
 Yahoo Finance
 Danaher (NYSE:DHR) jumps 4.2% this week, though earnings growth is still tracking behind five-year shareholder returns
The most you can lose on any stock (assuming you don't use leverage) is 100% of your money. But when you pick a company that is really flourishing, you can make more than 100%. Long term Danaher Corporation (NYSE:DHR) shareholders would be well aware of this, since the stock is up 196% in five years. We note the stock price is up 4.2% in the last seven days.
The past week has proven to be lucrative for Danaher investors, so let's see if fundamentals drove the company's five-year performance.
View our latest analysis for Danaher
While the efficient markets hypothesis continues to be taught by some, it has been proven that markets are over-reactive dynamic systems, and investors are not always rational. One imperfect but simple way to consider how the market perception of a company has shifted is to compare the change in the earnings per share (EPS) with the share price movement.
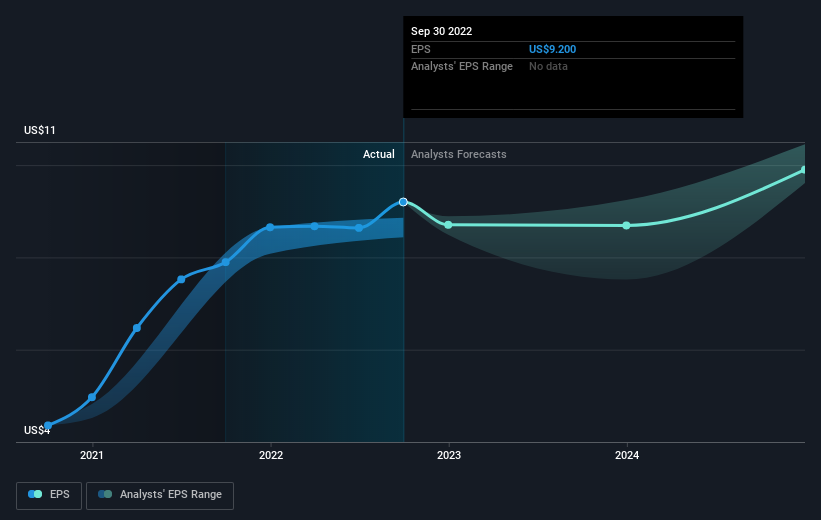
Over half a decade, Danaher managed to grow its earnings per share at 22% a year. This EPS growth is reasonably close to the 24% average annual increase in the share price. That suggests that the market sentiment around the company hasn't changed much over that time. Rather, the share price has approximately tracked EPS growth.
You can see below how EPS has changed over time (discover the exact values by clicking on the image).
It is of course excellent to see how Danaher has grown profits over the years, but the future is more important for shareholders. Take a more thorough look at Danaher's financial health with this free report on its balance sheet.
What About Dividends?
It is important to consider the total shareholder return, as well as the share price return, for any given stock. Whereas the share price return only reflects the change in the share price, the TSR includes the value of dividends (assuming they were reinvested) and the benefit of any discounted capital raising or spin-off. So for companies that pay a generous dividend, the TSR is often a lot higher than the share price return. We note that for Danaher the TSR over the last 5 years was 203%, which is better than the share price return mentioned above. The dividends paid by the company have thusly boosted the total shareholder return.
A Different Perspective
Although it hurts that Danaher returned a loss of 13% in the last twelve months, the broader market was actually worse, returning a loss of 15%. Of course, the long term returns are far more important and the good news is that over five years, the stock has returned 25% for each year. It could be that the business is just facing some short term problems, but shareholders should keep a close eye on the fundamentals. It's always interesting to track share price performance over the longer term. But to understand Danaher better, we need to consider many other factors. Even so, be aware that Danaher is showing 1 warning sign in our investment analysis , you should know about...
If you would prefer to check out another company -- one with potentially superior financials -- then do not miss this free list of companies that have proven they can grow earnings.
Please note, the market returns quoted in this article reflect the market weighted average returns of stocks that currently trade on US exchanges.
Have feedback on this article? Concerned about the content? Get in touch with us directly. Alternatively, email editorial-team (at) simplywallst.com.
This article by Simply Wall St is general in nature. We provide commentary based on historical data and analyst forecasts only using an unbiased methodology and our articles are not intended to be financial advice. It does not constitute a recommendation to buy or sell any stock, and does not take account of your objectives, or your financial situation. We aim to bring you long-term focused analysis driven by fundamental data. Note that our analysis may not factor in the latest price-sensitive company announcements or qualitative material. Simply Wall St has no position in any stocks mentioned.
Join A Paid User Research Session
You’ll receive a US$30 Amazon Gift card for 1 hour of your time while helping us build better investing tools for the individual investors like yourself. Sign up here
