
 Yahoo Finance
 The Dart Group (LON:DTG) Share Price Has Soared 410%, Delighting Many Shareholders

We think all investors should try to buy and hold high quality multi-year winners. While not every stock performs well, when investors win, they can win big. Just think about the savvy investors who held Dart Group PLC (LON:DTG) shares for the last five years, while they gained 410%. And this is just one example of the epic gains achieved by some long term investors. Also pleasing for shareholders was the 99% gain in the last three months. The company reported its financial results recently; you can catch up on the latest numbers by reading our company report.
Check out our latest analysis for Dart Group
While markets are a powerful pricing mechanism, share prices reflect investor sentiment, not just underlying business performance. One imperfect but simple way to consider how the market perception of a company has shifted is to compare the change in the earnings per share (EPS) with the share price movement.
During five years of share price growth, Dart Group achieved compound earnings per share (EPS) growth of 36% per year. So the EPS growth rate is rather close to the annualized share price gain of 39% per year. That suggests that the market sentiment around the company hasn't changed much over that time. Rather, the share price has approximately tracked EPS growth.
The graphic below depicts how EPS has changed over time (unveil the exact values by clicking on the image).
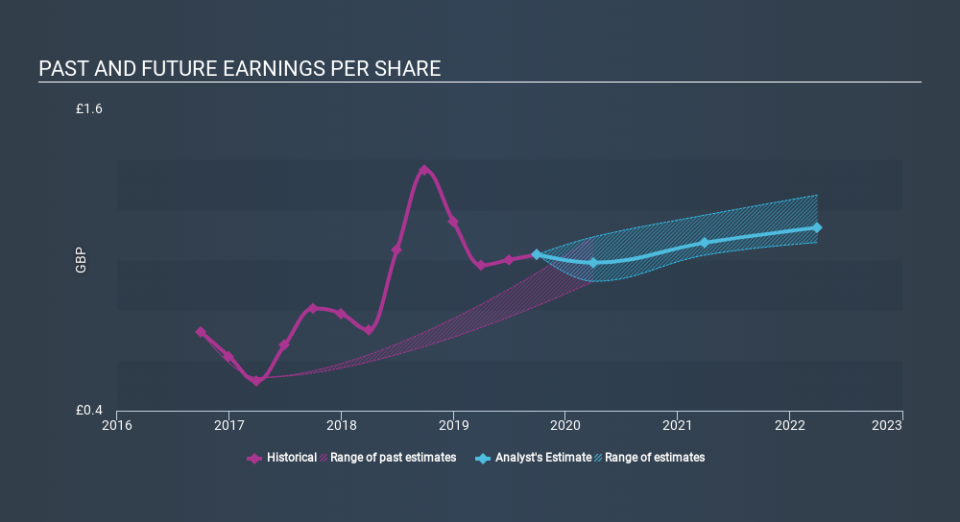
This free interactive report on Dart Group's earnings, revenue and cash flow is a great place to start, if you want to investigate the stock further.
What About Dividends?
When looking at investment returns, it is important to consider the difference between total shareholder return (TSR) and share price return. The TSR is a return calculation that accounts for the value of cash dividends (assuming that any dividend received was reinvested) and the calculated value of any discounted capital raisings and spin-offs. Arguably, the TSR gives a more comprehensive picture of the return generated by a stock. As it happens, Dart Group's TSR for the last 5 years was 435%, which exceeds the share price return mentioned earlier. And there's no prize for guessing that the dividend payments largely explain the divergence!
A Different Perspective
We're pleased to report that Dart Group shareholders have received a total shareholder return of 77% over one year. That's including the dividend. Since the one-year TSR is better than the five-year TSR (the latter coming in at 40% per year), it would seem that the stock's performance has improved in recent times. In the best case scenario, this may hint at some real business momentum, implying that now could be a great time to delve deeper. Most investors take the time to check the data on insider transactions. You can click here to see if insiders have been buying or selling.
Of course Dart Group may not be the best stock to buy. So you may wish to see this free collection of growth stocks.
Please note, the market returns quoted in this article reflect the market weighted average returns of stocks that currently trade on GB exchanges.
If you spot an error that warrants correction, please contact the editor at editorial-team@simplywallst.com. This article by Simply Wall St is general in nature. It does not constitute a recommendation to buy or sell any stock, and does not take account of your objectives, or your financial situation. Simply Wall St has no position in the stocks mentioned.
We aim to bring you long-term focused research analysis driven by fundamental data. Note that our analysis may not factor in the latest price-sensitive company announcements or qualitative material. Thank you for reading.
