
 Yahoo Finance
 Is DaVita (DVA) a Great Stock for Value Investors Right Now?


Value investing is easily one of the most popular ways to find great stocks in any market environment. After all, who wouldn’t want to find stocks that are either flying under the radar and are compelling buys, or offer up tantalizing discounts when compared to fair value?
One way to find these companies is by looking at several key metrics and financial ratios, many of which are crucial in the value stock selection process. Let’s put DaVita Inc. DVA stock into this equation and find out if it is a good choice for value-oriented investors right now, or if investors subscribing to this methodology should look elsewhere for top picks:
PE Ratio
A key metric that value investors always look at is the Price to Earnings Ratio, or PE for short. This shows us how much investors are willing to pay for each dollar of earnings in a given stock, and is easily one of the most popular financial ratios in the world. The best use of the PE ratio is to compare the stock’s current PE ratio with: a) where this ratio has been in the past; b) how it compares to the average for the industry/sector; and c) how it compares to the market as a whole.
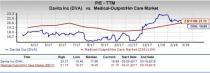
On this front, DaVita has a trailing twelve months PE ratio of 19.9, as you can see in the chart below:
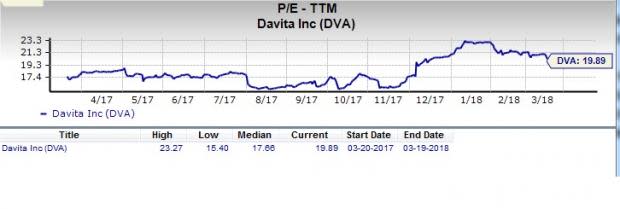
This level actually compares pretty favorably with the market at large, as the PE for the S&P 500 stands at about 21.3. If we focus on the long-term PE trend, DaVita’s current PE level puts it below its midpoint over the past five years.

Further, the stock’s PE also compares favorably with its industry’s trailing twelve months PE ratio, which stands at about 21.5. At the very least, this indicates that the stock is relatively undervalued right now, compared to its peers.

We should also point out that DaVita has a forward PE ratio (price relative to this year’s earnings) of 16.5, so it is fair to say that a slightly more value-oriented path may be ahead for the stock in the near term too.
P/CF Ratio
An often overlooked ratio that can still be a great indicator of value is the price/cash flow metric. This ratio doesn’t take amortization and depreciation into account, so can give a more accurate picture of the financial health in a business. This is a preferred metric to some valuation investors because cash flows are (a) generally less prone to manipulation by the company’s management and (b) are less affected by variation in accounting policies between different companies.
The ratio is generally applied to find out whether a company’s stock is overpriced or underpriced with reference to its cash flows generation potential compared with its competitors. However, it is not commonly used for cross-industry comparison, as the average price to cash flow ratio varies from industry to industry.
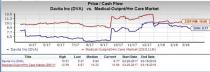
In this case, DaVita’s P/CF ratio of 8.8 is significantly lower than the industry average of 10.6, which indicates that the stock is undervalued in this respect.

Broad Value Outlook
In aggregate, DaVita currently has a Zacks Value Style Score of A, putting it into the top 20% of all stocks we cover from this look. This makes DaVita a solid choice for value investors, and some of its other key metrics make this pretty clear too.
For example, the PEG ratio for the stock is 8.9, a level that is far lower than the industry average of 13.3. The PEG ratio is a modified PE ratio that takes into account the stock’s earnings growth rate. Also, its P/S ratio (another great indicator of value) comes in at 0.9, which is somewhat better than the industry average of 1.1. Clearly, DVA is a solid choice on the value front from multiple angles.
What About the Stock Overall?
Though DaVita might be a good choice for value investors, there are plenty of other factors to consider before investing in this name. In particular, it is worth noting that the company has a Growth grade of B and a Momentum score of A. This gives DVA a Zacks VGM score—or its overarching fundamental grade—of A. (You can read more about the Zacks Style Scores here >>)
Meanwhile, the company’s recent earnings estimates have been encouraging. The current quarter has seen three estimates go higher in the past sixty days compared to one lower, while the full year estimate has seen four up and two down in the same time period.
As a result, the current quarter consensus estimate has increased by 7.1% in the past two months, while the full year estimate has inched higher by 8.4%. You can see the consensus estimate trend and recent price action for the stock in the chart below:
DaVita Inc. Price and Consensus
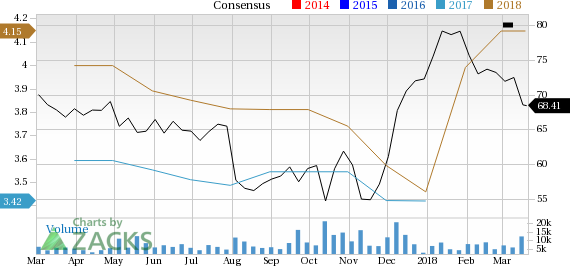
DaVita Inc. Price and Consensus | DaVita Inc. Quote
Even though DaVita has a better estimates trend, the stock has just a Zacks Rank #3 (Hold). That is why we are looking for in-line performance from the company in the near term.
Bottom Line
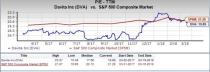
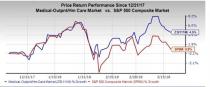
DaVita is an inspired choice for value investors, as it is hard to beat its incredible lineup of statistics on this front. Moreover, a strong industry rank (Top 34% out of more than 250 industries) further supports the growth potential of the stock. In fact, over the past three months, the industry to which it belongs has clearly outperformed the broader market, as you can see below:
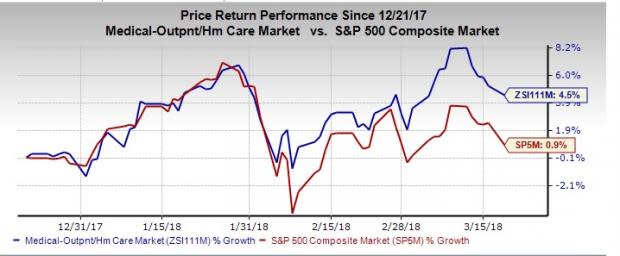
So, it might pay for value investors to delve deeper into the company’s prospects, as fundamentals indicate that this stock could be a compelling pick.
Today's Stocks from Zacks' Hottest Strategies
It's hard to believe, even for us at Zacks. But while the market gained +18.8% from 2016 - Q1 2017, our top stock-picking screens have returned +157.0%, +128.0%, +97.8%, +94.7%, and +90.2% respectively.
And this outperformance has not just been a recent phenomenon. Over the years it has been remarkably consistent. From 2000 - Q1 2017, the composite yearly average gain for these strategies has beaten the market more than 11X over. Maybe even more remarkable is the fact that we're willing to share their latest stocks with you without cost or obligation.
See Them Free>>
Want the latest recommendations from Zacks Investment Research? Today, you can download 7 Best Stocks for the Next 30 Days. Click to get this free report
DaVita Inc. (DVA) : Free Stock Analysis Report
To read this article on Zacks.com click here.
Zacks Investment Research
