
 Yahoo Finance
 Is Debenhams plc (LON:DEB) A Financially Sound Company?

Debenhams plc (LON:DEB) is a small-cap stock with a market capitalization of UK£239.10m. While investors primarily focus on the growth potential and competitive landscape of the small-cap companies, they end up ignoring a key aspect, which could be the biggest threat to its existence: its financial health. Why is it important? Multiline Retail businesses operating in the environment facing headwinds from current disruption, in particular ones that run negative earnings, are more likely to be higher risk. Evaluating financial health as part of your investment thesis is essential. Here are few basic financial health checks you should consider before taking the plunge. Nevertheless, since I only look at basic financial figures, I’d encourage you to dig deeper yourself into DEB here.
How does DEB’s operating cash flow stack up against its debt?
DEB’s debt levels have fallen from UK£335.50m to UK£315.90m over the last 12 months – this includes both the current and long-term debt. With this debt payback, the current cash and short-term investment levels stands at UK£40.00m , ready to deploy into the business. Additionally, DEB has generated cash from operations of UK£173.00m in the last twelve months, leading to an operating cash to total debt ratio of 54.76%, meaning that DEB’s current level of operating cash is high enough to cover debt. This ratio can also be interpreted as a measure of efficiency for unprofitable companies since metrics such as return on asset (ROA) requires positive earnings. In DEB’s case, it is able to generate 0.55x cash from its debt capital.
Can DEB pay its short-term liabilities?
With current liabilities at UK£671.70m, the company is not able to meet these obligations given the level of current assets of UK£445.50m, with a current ratio of 0.66x below the prudent level of 3x.
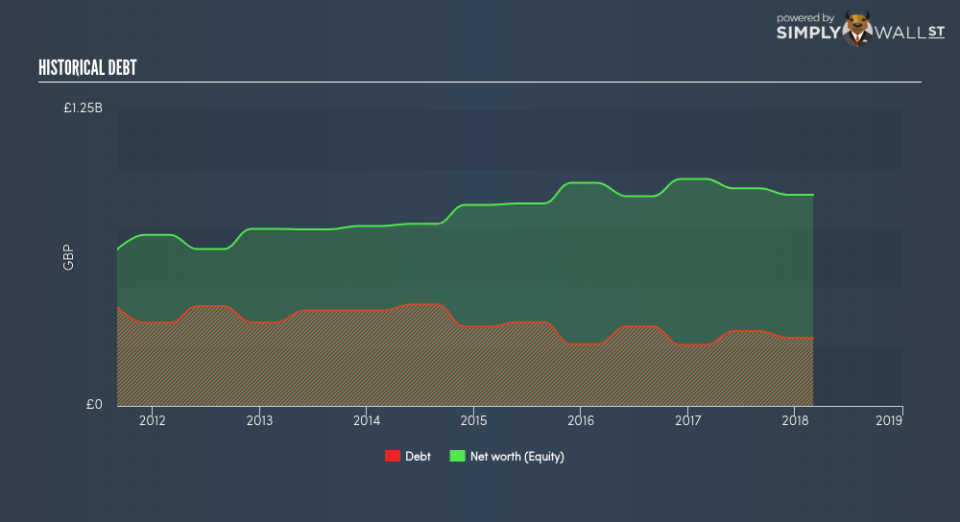
Can DEB service its debt comfortably?
DEB’s level of debt is appropriate relative to its total equity, at 32.27%. DEB is not taking on too much debt commitment, which can be restrictive and risky for equity-holders. DEB’s risk around capital structure is low, and the company has the headroom and ability to raise debt should it need to in the future.
Next Steps:
DEB’s high cash coverage and appropriate debt levels indicate its ability to utilise its borrowings efficiently in order to generate ample cash flow. Though its low liquidity raises concerns over whether current asset management practices are properly implemented for the small-cap. This is only a rough assessment of financial health, and I’m sure DEB has company-specific issues impacting its capital structure decisions. I recommend you continue to research Debenhams to get a more holistic view of the stock by looking at:
Future Outlook: What are well-informed industry analysts predicting for DEB’s future growth? Take a look at our free research report of analyst consensus for DEB’s outlook.
Valuation: What is DEB worth today? Is the stock undervalued, even when its growth outlook is factored into its intrinsic value? The intrinsic value infographic in our free research report helps visualize whether DEB is currently mispriced by the market.
Other High-Performing Stocks: Are there other stocks that provide better prospects with proven track records? Explore our free list of these great stocks here.
To help readers see pass the short term volatility of the financial market, we aim to bring you a long-term focused research analysis purely driven by fundamental data. Note that our analysis does not factor in the latest price sensitive company announcements.
The author is an independent contributor and at the time of publication had no position in the stocks mentioned.
