
 Yahoo Finance
 Declining Stock and Decent Financials: Is The Market Wrong About Green Cross Health Limited (NZSE:GXH)?
Green Cross Health (NZSE:GXH) has had a rough three months with its share price down 8.1%. But if you pay close attention, you might find that its key financial indicators look quite decent, which could mean that the stock could potentially rise in the long-term given how markets usually reward more resilient long-term fundamentals. In this article, we decided to focus on Green Cross Health's ROE.
Return on equity or ROE is a key measure used to assess how efficiently a company's management is utilizing the company's capital. Simply put, it is used to assess the profitability of a company in relation to its equity capital.
Check out our latest analysis for Green Cross Health
How Is ROE Calculated?
The formula for ROE is:
Return on Equity = Net Profit (from continuing operations) ÷ Shareholders' Equity
So, based on the above formula, the ROE for Green Cross Health is:
11% = NZ$17m ÷ NZ$163m (Based on the trailing twelve months to September 2023).
The 'return' is the yearly profit. That means that for every NZ$1 worth of shareholders' equity, the company generated NZ$0.11 in profit.
What Has ROE Got To Do With Earnings Growth?
So far, we've learned that ROE is a measure of a company's profitability. Depending on how much of these profits the company reinvests or "retains", and how effectively it does so, we are then able to assess a company’s earnings growth potential. Assuming all else is equal, companies that have both a higher return on equity and higher profit retention are usually the ones that have a higher growth rate when compared to companies that don't have the same features.
Green Cross Health's Earnings Growth And 11% ROE
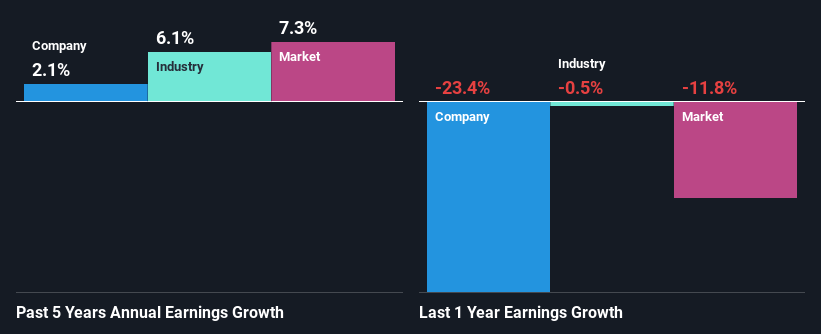
To begin with, Green Cross Health seems to have a respectable ROE. Yet, the fact that the company's ROE is lower than the industry average of 16% does temper our expectations. Additionally, the low net income growth of 2.1% seen by Green Cross Health over the past five years doesn't paint a very bright picture. Not to forget, the company does have a decent ROE to begin with, just that it is lower than the industry average. Therefore, the low earnings growth could be the result of other factors. For example, it could be that the company has a high payout ratio or the business has allocated capital poorly, for instance.
We then compared Green Cross Health's net income growth with the industry and found that the company's growth figure is lower than the average industry growth rate of 6.1% in the same 5-year period, which is a bit concerning.
Earnings growth is an important metric to consider when valuing a stock. The investor should try to establish if the expected growth or decline in earnings, whichever the case may be, is priced in. By doing so, they will have an idea if the stock is headed into clear blue waters or if swampy waters await. One good indicator of expected earnings growth is the P/E ratio which determines the price the market is willing to pay for a stock based on its earnings prospects. So, you may want to check if Green Cross Health is trading on a high P/E or a low P/E, relative to its industry.
Is Green Cross Health Efficiently Re-investing Its Profits?
Despite having a moderate three-year median payout ratio of 46% (implying that the company retains the remaining 54% of its income), Green Cross Health's earnings growth was quite low. So there might be other factors at play here which could potentially be hampering growth. For example, the business has faced some headwinds.
In addition, Green Cross Health has been paying dividends over a period of at least ten years suggesting that keeping up dividend payments is way more important to the management even if it comes at the cost of business growth.
Summary
In total, it does look like Green Cross Health has some positive aspects to its business. Yet, the low earnings growth is a bit concerning, especially given that the company has a respectable rate of return and is reinvesting a huge portion of its profits. By the looks of it, there could be some other factors, not necessarily in control of the business, that's preventing growth. While we won't completely dismiss the company, what we would do, is try to ascertain how risky the business is to make a more informed decision around the company. Our risks dashboard would have the 2 risks we have identified for Green Cross Health.
Have feedback on this article? Concerned about the content? Get in touch with us directly. Alternatively, email editorial-team (at) simplywallst.com.
This article by Simply Wall St is general in nature. We provide commentary based on historical data and analyst forecasts only using an unbiased methodology and our articles are not intended to be financial advice. It does not constitute a recommendation to buy or sell any stock, and does not take account of your objectives, or your financial situation. We aim to bring you long-term focused analysis driven by fundamental data. Note that our analysis may not factor in the latest price-sensitive company announcements or qualitative material. Simply Wall St has no position in any stocks mentioned.
