
 Yahoo Finance
 Declining Stock and Solid Fundamentals: Is The Market Wrong About Grafton Group plc (LON:GFTU)?
It is hard to get excited after looking at Grafton Group's (LON:GFTU) recent performance, when its stock has declined 11% over the past three months. However, stock prices are usually driven by a company’s financial performance over the long term, which in this case looks quite promising. In this article, we decided to focus on Grafton Group's ROE.
Return on equity or ROE is a key measure used to assess how efficiently a company's management is utilizing the company's capital. Simply put, it is used to assess the profitability of a company in relation to its equity capital.
View our latest analysis for Grafton Group
How Is ROE Calculated?
Return on equity can be calculated by using the formula:
Return on Equity = Net Profit (from continuing operations) ÷ Shareholders' Equity
So, based on the above formula, the ROE for Grafton Group is:
12% = UK£209m ÷ UK£1.7b (Based on the trailing twelve months to December 2022).
The 'return' is the amount earned after tax over the last twelve months. Another way to think of that is that for every £1 worth of equity, the company was able to earn £0.12 in profit.
Why Is ROE Important For Earnings Growth?
Thus far, we have learned that ROE measures how efficiently a company is generating its profits. Depending on how much of these profits the company reinvests or "retains", and how effectively it does so, we are then able to assess a company’s earnings growth potential. Assuming everything else remains unchanged, the higher the ROE and profit retention, the higher the growth rate of a company compared to companies that don't necessarily bear these characteristics.
Grafton Group's Earnings Growth And 12% ROE
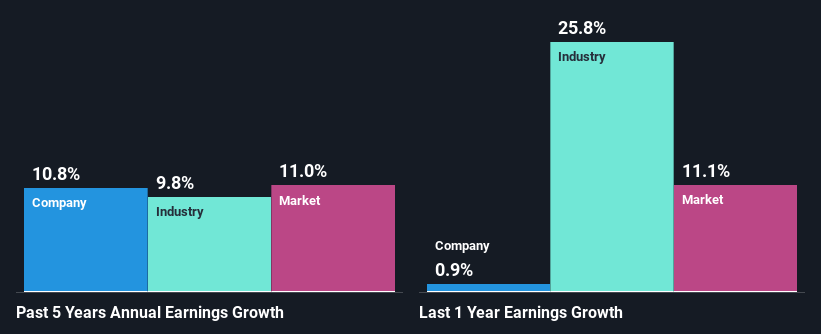
To start with, Grafton Group's ROE looks acceptable. And on comparing with the industry, we found that the the average industry ROE is similar at 15%. This certainly adds some context to Grafton Group's moderate 11% net income growth seen over the past five years.
We then performed a comparison between Grafton Group's net income growth with the industry, which revealed that the company's growth is similar to the average industry growth of 9.8% in the same period.
Earnings growth is an important metric to consider when valuing a stock. The investor should try to establish if the expected growth or decline in earnings, whichever the case may be, is priced in. This then helps them determine if the stock is placed for a bright or bleak future. Has the market priced in the future outlook for GFTU? You can find out in our latest intrinsic value infographic research report.
Is Grafton Group Using Its Retained Earnings Effectively?
With a three-year median payout ratio of 32% (implying that the company retains 68% of its profits), it seems that Grafton Group is reinvesting efficiently in a way that it sees respectable amount growth in its earnings and pays a dividend that's well covered.
Moreover, Grafton Group is determined to keep sharing its profits with shareholders which we infer from its long history of paying a dividend for at least ten years. Upon studying the latest analysts' consensus data, we found that the company's future payout ratio is expected to rise to 41% over the next three years. Consequently, the higher expected payout ratio explains the decline in the company's expected ROE (to 8.6%) over the same period.
Summary
In total, we are pretty happy with Grafton Group's performance. Specifically, we like that the company is reinvesting a huge chunk of its profits at a high rate of return. This of course has caused the company to see substantial growth in its earnings. With that said, on studying the latest analyst forecasts, we found that while the company has seen growth in its past earnings, analysts expect its future earnings to shrink. To know more about the company's future earnings growth forecasts take a look at this free report on analyst forecasts for the company to find out more.
Have feedback on this article? Concerned about the content? Get in touch with us directly. Alternatively, email editorial-team (at) simplywallst.com.
This article by Simply Wall St is general in nature. We provide commentary based on historical data and analyst forecasts only using an unbiased methodology and our articles are not intended to be financial advice. It does not constitute a recommendation to buy or sell any stock, and does not take account of your objectives, or your financial situation. We aim to bring you long-term focused analysis driven by fundamental data. Note that our analysis may not factor in the latest price-sensitive company announcements or qualitative material. Simply Wall St has no position in any stocks mentioned.
Join A Paid User Research Session
You’ll receive a US$30 Amazon Gift card for 1 hour of your time while helping us build better investing tools for the individual investors like yourself. Sign up here
