
 Yahoo Finance
 Declining Stock and Solid Fundamentals: Is The Market Wrong About Supreme Plc (LON:SUP)?
It is hard to get excited after looking at Supreme's (LON:SUP) recent performance, when its stock has declined 12% over the past month. However, stock prices are usually driven by a company’s financial performance over the long term, which in this case looks quite promising. In this article, we decided to focus on Supreme's ROE.
ROE or return on equity is a useful tool to assess how effectively a company can generate returns on the investment it received from its shareholders. Simply put, it is used to assess the profitability of a company in relation to its equity capital.
Check out our latest analysis for Supreme
How Do You Calculate Return On Equity?
Return on equity can be calculated by using the formula:
Return on Equity = Net Profit (from continuing operations) ÷ Shareholders' Equity
So, based on the above formula, the ROE for Supreme is:
42% = UK£11m ÷ UK£26m (Based on the trailing twelve months to September 2021).
The 'return' is the yearly profit. One way to conceptualize this is that for each £1 of shareholders' capital it has, the company made £0.42 in profit.
What Is The Relationship Between ROE And Earnings Growth?
Thus far, we have learned that ROE measures how efficiently a company is generating its profits. Depending on how much of these profits the company reinvests or "retains", and how effectively it does so, we are then able to assess a company’s earnings growth potential. Assuming all else is equal, companies that have both a higher return on equity and higher profit retention are usually the ones that have a higher growth rate when compared to companies that don't have the same features.
Supreme's Earnings Growth And 42% ROE
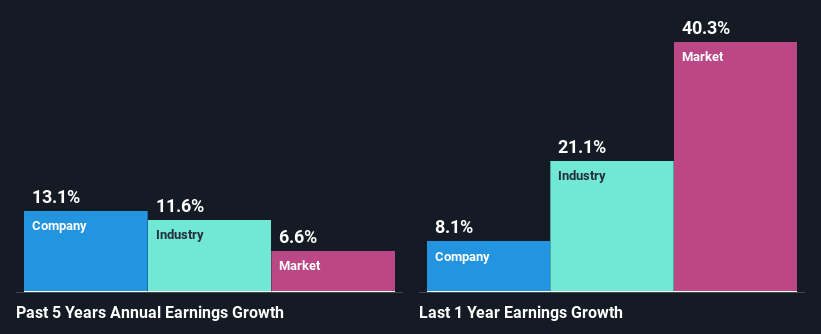
First thing first, we like that Supreme has an impressive ROE. Additionally, the company's ROE is higher compared to the industry average of 19% which is quite remarkable. This likely paved the way for the modest 13% net income growth seen by Supreme over the past five years. growth
Given that the industry shrunk its earnings at a rate of 12% in the same period, the net income growth of the company is quite impressive.
The basis for attaching value to a company is, to a great extent, tied to its earnings growth. What investors need to determine next is if the expected earnings growth, or the lack of it, is already built into the share price. Doing so will help them establish if the stock's future looks promising or ominous. Has the market priced in the future outlook for SUP? You can find out in our latest intrinsic value infographic research report.
Is Supreme Making Efficient Use Of Its Profits?
With a three-year median payout ratio of 45% (implying that the company retains 55% of its profits), it seems that Supreme is reinvesting efficiently in a way that it sees respectable amount growth in its earnings and pays a dividend that's well covered.
Upon studying the latest analysts' consensus data, we found that the company is expected to keep paying out approximately 51% of its profits over the next three years.
Conclusion
On the whole, we feel that Supreme's performance has been quite good. Particularly, we like that the company is reinvesting heavily into its business, and at a high rate of return. Unsurprisingly, this has led to an impressive earnings growth. We also studied the latest analyst forecasts and found that the company's earnings growth is expected be similar to its current growth rate. To know more about the latest analysts predictions for the company, check out this visualization of analyst forecasts for the company.
Have feedback on this article? Concerned about the content? Get in touch with us directly. Alternatively, email editorial-team (at) simplywallst.com.
This article by Simply Wall St is general in nature. We provide commentary based on historical data and analyst forecasts only using an unbiased methodology and our articles are not intended to be financial advice. It does not constitute a recommendation to buy or sell any stock, and does not take account of your objectives, or your financial situation. We aim to bring you long-term focused analysis driven by fundamental data. Note that our analysis may not factor in the latest price-sensitive company announcements or qualitative material. Simply Wall St has no position in any stocks mentioned.
