
 Yahoo Finance
 Deere Reports Second Quarter Net Income of $2.370 Billion
Quarterly results underscore sound execution in the face of challenging market conditions.
Global agricultural and turf demand further softens while the construction industry remains stable.
Full-year net income forecast updated to approximately $7.0 billion.
MOLINE, Ill., May 16, 2024 /PRNewswire/ -- Deere & Company (NYSE: DE) reported net income of $2.370 billion for the second quarter ended April 28, 2024, or $8.53 per share, compared with net income of $2.860 billion, or $9.65 per share, for the quarter ended April 30, 2023. For the first six months of the year, net income attributable to Deere & Company was $4.121 billion, or $14.74 per share, compared with $4.819 billion, or $16.18 per share, for the same period last year.
Worldwide net sales and revenues decreased 12 percent, to $15.235 billion, for the second quarter of 2024 and decreased 9 percent, to $27.420 billion, for six months. Net sales were $13.610 billion for the quarter and $24.097 billion for six months, compared with $16.079 billion and $27.481 billion last year.
"John Deere's second-quarter results were noteworthy in light of continued changes across the global agricultural sector," stated John C. May, chairman and chief executive officer. "Thanks to the dedication and hard work of our team, we continue to demonstrate structurally higher performance levels across business cycles and are benefitting from stability in construction end markets amid declining agricultural and turf demand."
Company Outlook & Summary
Net income attributable to Deere & Company for fiscal 2024 is forecasted to be approximately $7.0 billion.
"We are proactively managing our production and inventory levels to adapt to demand changes and position the business for the future," May explained. "Despite market conditions, we are committed to our strategy and are actively investing in and deploying innovative technologies, products, and solutions to ensure our customers' success."
Deere & Company | Second Quarter | Year to Date | |||||||||||||||
$ in millions, except per share amounts | 2024 | 2023 | % Change | 2024 | 2023 | % Change | |||||||||||
Net sales and revenues | $ | 15,235 | $ | 17,387 | -12 % | $ | 27,420 | $ | 30,038 | -9 % | |||||||
Net income | $ | 2,370 | $ | 2,860 | -17 % | $ | 4,121 | $ | 4,819 | -14 % | |||||||
Fully diluted EPS | $ | 8.53 | $ | 9.65 | $ | 14.74 | $ | 16.18 | |||||||||
Prior period results were affected by a special item. See Note 1 of the financial statements for further details.
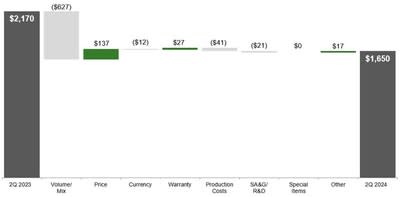
Production & Precision Agriculture | Second Quarter | ||||||||
$ in millions | 2024 | 2023 | % Change | ||||||
Net sales | $ | 6,581 | $ | 7,822 | -16 % | ||||
Operating profit | $ | 1,650 | $ | 2,170 | -24 % | ||||
Operating margin | 25.1 % | 27.7 % | |||||||
Production and precision agriculture sales decreased for the quarter as a result of lower shipment volumes, partially offset by price realization. Operating profit decreased due to lower shipment volumes and higher production costs, partially offset by price realization.
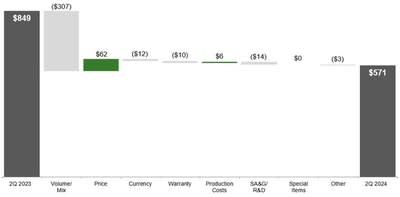
Small Agriculture & Turf | Second Quarter | ||||||||
$ in millions | 2024 | 2023 | % Change | ||||||
Net sales | $ | 3,185 | $ | 4,145 | -23 % | ||||
Operating profit | $ | 571 | $ | 849 | -33 % | ||||
Operating margin | 17.9 % | 20.5 % | |||||||
Small agriculture and turf sales decreased for the quarter as a result of lower shipment volumes, partially offset by price realization. Operating profit decreased due to lower shipment volumes, partially offset by price realization.
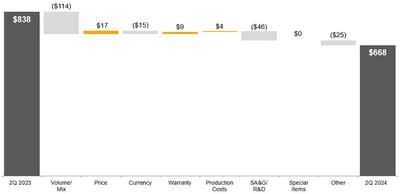
Construction & Forestry | Second Quarter | ||||||||
$ in millions | 2024 | 2023 | % Change | ||||||
Net sales | $ | 3,844 | $ | 4,112 | -7 % | ||||
Operating profit | $ | 668 | $ | 838 | -20 % | ||||
Operating margin | 17.4 % | 20.4 % | |||||||
Construction and forestry sales decreased for the quarter due to lower shipment volumes. Operating profit decreased due to lower shipment volumes and higher SA&G and R&D expenses.
Financial Services | Second Quarter | ||||||||
$ in millions | 2024 | 2023 | % Change | ||||||
Net income | $ | 162 | $ | 28 | 479 % | ||||
Financial services net income for the quarter increased due to income earned on higher average portfolio balances, partially offset by a higher provision for credit losses and less-favorable financing spreads. The results of the prior period were also affected by a correction of the accounting treatment for financing incentives offered to John Deere dealers. The cumulative effect of this correction, $173 million pretax ($135 million after-tax), was recorded in the second quarter of 2023.
Industry Outlook for Fiscal 2024 | |||||||
Agriculture & Turf | |||||||
U.S. & Canada: | |||||||
Large Ag | Down ~ 15% | ||||||
Small Ag & Turf | Down ~ 10% | ||||||
Europe | Down ~ 15% | ||||||
South America (Tractors & Combines) | Down 15 to 20% | ||||||
Asia | Down moderately | ||||||
Construction & Forestry | |||||||
U.S. & Canada: | |||||||
Construction Equipment | Flat to Down 5% | ||||||
Compact Construction Equipment | Flat | ||||||
Global Forestry | Down ~ 10% | ||||||
Global Roadbuilding | Flat to Down 5% |
Deere Segment Outlook for Fiscal 2024 | Currency | Price | |||||
$ in millions | Net Sales | Translation | Realization | ||||
Production & Precision Ag | Down 20% to 25% | ~ Flat | +1.5 % | ||||
Small Ag & Turf | Down 20% to 25% | ~ Flat | +1.5 % | ||||
Construction & Forestry | Down 5% to 10% | ~ Flat | +1.5 % | ||||
Financial Services | Net Income | ~$ 770 |
Financial Services. Fiscal-year 2024 net income attributable to Deere & Company for the financial services operations is forecasted to be approximately $770 million. Results are expected to be higher than fiscal year 2023 due to income earned on a higher average portfolio, partially offset by a higher provision for credit losses and less-favorable financing spreads. A correction of the accounting treatment for financing incentives offered to John Deere dealers impacted 2023 financial results. The cumulative effect of this correction, $173 million pretax ($135 million after-tax), was recorded in the second quarter of 2023.
FORWARD-LOOKING STATEMENTS
Certain statements contained herein, including in the section entitled "Company Outlook & Summary," "Industry Outlook," and "Deere Segment Outlook," relating to future events, expectations, and trends constitute "forward-looking statements" as defined in the Private Securities Litigation Reform Act of 1995 and involve factors that are subject to change, assumptions, risks, and uncertainties that could cause actual results to differ materially. Some of these risks and uncertainties could affect all lines of the company's operations generally while others could more heavily affect a particular line of business.
Forward-looking statements are based on currently available information and current assumptions, expectations, and projections about future events and should not be relied upon. Except as required by law, the company expressly disclaims any obligation to update or revise its forward-looking statements. Many factors, risks, and uncertainties could cause actual results to differ materially from these forward-looking statements. Among these factors are risks related to:
changes in and compliance with U.S., foreign and international laws, regulations, and policies relating to trade, economic sanctions, data privacy, spending, taxing, banking, monetary, environmental (including climate change and engine emissions), and farming policies;
political, economic, and social instability of the geographies in which the company operates, including the ongoing war between Russia and Ukraine and the conflict in the Middle East;
adverse macroeconomic conditions, including unemployment, inflation, rising interest rates, changes in consumer practices due to slower economic growth, and regional or global liquidity constraints;
worldwide demand for food and different forms of renewable energy;
the ability to execute business strategies, including the company's Smart Industrial Operating Model, Leap Ambitions, and mergers and acquisitions;
the ability to understand and meet customers' changing expectations and demand for John Deere products and solutions;
accurately forecasting customer demand for products and services and adequately managing inventory;
the ability to integrate new technology, including automation and machine learning, and deliver precision technology and solutions to customers;
changes to governmental communications channels (radio frequency technology);
the ability to adapt in highly competitive markets;
dealer practices and their ability to manage distribution of John Deere products and support and service precision technology solutions;
changes in climate patterns, unfavorable weather events, and natural disasters;
governmental and other actions designed to address climate change in connection with a transition to a lower-carbon economy;
higher interest rates and currency fluctuations which could adversely affect the U.S. dollar, customer confidence, access to capital, and demand for John Deere products and solutions;
availability and price of raw materials, components, and whole goods;
delays or disruptions in the company's supply chain;
our equipment fails to perform as expected, which could result in warranty claims, post-sales repairs or recalls, product liability litigation, and regulatory investigations;
the ability to attract, develop, engage, and retain qualified personnel;
security breaches, cybersecurity attacks, technology failures, and other disruptions to John Deere information technology infrastructure and products;
loss of or challenges to intellectual property rights;
legislation introduced or enacted that could affect the company's business model and intellectual property, such as right to repair or right to modify legislation;
investigations, claims, lawsuits, or other legal proceedings;
events that damage the company's reputation or brand;
the agricultural business cycle, which can be unpredictable and is affected by factors such as world grain stocks, available farm acres, acreage planted, soil conditions, harvest yields, prices for commodities and livestock, input costs, and availability of transport for crops; and
housing starts and supply, real estate and housing prices, levels of public and non-residential construction, and infrastructure investment.
Further information concerning the company and its businesses, including factors that could materially affect the financial results, is included in the company's filings with the SEC (including, but not limited to, the factors discussed in Item 1A. "Risk Factors" of the company's most recent Annual Report on Form 10-K and subsequent Quarterly Reports on Form 10-Q). There also may be other factors that the company cannot anticipate or that are not described herein because the company does not currently perceive them to be material.
DEERE & COMPANY SECOND QUARTER 2024 PRESS RELEASE (In millions of dollars) Unaudited | |||||||||||||||||
Three Months Ended | Six Months Ended | ||||||||||||||||
April 28 | April 30 | % | April 28 | April 30 | % | ||||||||||||
2024 | 2023 | Change | 2024 | 2023 | Change | ||||||||||||
Net sales and revenues: | |||||||||||||||||
Production & precision ag net sales | $ | 6,581 | $ | 7,822 | -16 | $ | 11,430 | $ | 13,021 | -12 | |||||||
Small ag & turf net sales | 3,185 | 4,145 | -23 | 5,610 | 7,146 | -21 | |||||||||||
Construction & forestry net sales | 3,844 | 4,112 | -7 | 7,057 | 7,314 | -4 | |||||||||||
Financial services revenues | 1,395 | 1,107 | +26 | 2,770 | 2,147 | +29 | |||||||||||
Other revenues | 230 | 201 | +14 | 553 | 410 | +35 | |||||||||||
Total net sales and revenues | $ | 15,235 | $ | 17,387 | -12 | $ | 27,420 | $ | 30,038 | -9 | |||||||
Operating profit: * | |||||||||||||||||
Production & precision ag | $ | 1,650 | $ | 2,170 | -24 | $ | 2,695 | $ | 3,378 | -20 | |||||||
Small ag & turf | 571 | 849 | -33 | 897 | 1,296 | -31 | |||||||||||
Construction & forestry | 668 | 838 | -20 | 1,234 | 1,463 | -16 | |||||||||||
Financial services | 209 | 41 | +410 | 466 | 279 | +67 | |||||||||||
Total operating profit | 3,098 | 3,898 | -21 | 5,292 | 6,416 | -18 | |||||||||||
Reconciling items ** | 23 | (47) | 49 | (69) | |||||||||||||
Income taxes | (751) | (991) | -24 | (1,220) | (1,528) | -20 | |||||||||||
Net income attributable to Deere & Company | $ | 2,370 | $ | 2,860 | -17 | $ | 4,121 | $ | 4,819 | -14 | |||||||
* | Operating profit is income from continuing operations before corporate expenses, certain external interest expenses, certain foreign exchange gains and losses, and income taxes. Operating profit for financial services includes the effect of interest expense and foreign exchange gains or losses. |
** | Reconciling items are primarily corporate expenses, certain interest income and expenses, certain foreign exchange gains and losses, pension and postretirement benefit costs excluding the service cost component, equity in income of unconsolidated affiliates, and net income attributable to noncontrolling interests. |
DEERE & COMPANY STATEMENTS OF CONSOLIDATED INCOME For the Three and Six Months Ended April 28, 2024 and April 30, 2023 (In millions of dollars and shares except per share amounts) Unaudited | |||||||||||||
Three Months Ended | Six Months Ended | ||||||||||||
2024 | 2023 | 2024 | 2023 | ||||||||||
Net Sales and Revenues | |||||||||||||
Net sales | $ | 13,610 | $ | 16,079 | $ | 24,097 | $ | 27,481 | |||||
Finance and interest income | 1,387 | 1,079 | 2,746 | 2,073 | |||||||||
Other income | 238 | 229 | 577 | 484 | |||||||||
Total | 15,235 | 17,387 | 27,420 | 30,038 | |||||||||
Costs and Expenses | |||||||||||||
Cost of sales | 9,157 | 10,730 | 16,357 | 18,663 | |||||||||
Research and development expenses | 565 | 547 | 1,098 | 1,043 | |||||||||
Selling, administrative and general expenses | 1,265 | 1,330 | 2,330 | 2,283 | |||||||||
Interest expense | 836 | 569 | 1,638 | 1,049 | |||||||||
Other operating expenses | 295 | 363 | 664 | 660 | |||||||||
Total | 12,118 | 13,539 | 22,087 | 23,698 | |||||||||
Income of Consolidated Group before Income Taxes | 3,117 | 3,848 | 5,333 | 6,340 | |||||||||
Provision for income taxes | 751 | 991 | 1,220 | 1,528 | |||||||||
Income of Consolidated Group | 2,366 | 2,857 | 4,113 | 4,812 | |||||||||
Equity in income of unconsolidated affiliates | 2 | 2 | 3 | 3 | |||||||||
Net Income | 2,368 | 2,859 | 4,116 | 4,815 | |||||||||
Less: Net loss attributable to noncontrolling interests | (2) | (1) | (5) | (4) | |||||||||
Net Income Attributable to Deere & Company | $ | 2,370 | $ | 2,860 | $ | 4,121 | $ | 4,819 | |||||
Per Share Data | |||||||||||||
Basic | $ | 8.56 | $ | 9.69 | $ | 14.80 | $ | 16.26 | |||||
Diluted | 8.53 | 9.65 | 14.74 | 16.18 | |||||||||
Dividends declared | 1.47 | 1.25 | 2.94 | 2.45 | |||||||||
Dividends paid | 1.47 | 1.20 | 2.82 | 2.33 | |||||||||
Average Shares Outstanding | |||||||||||||
Basic | 276.8 | 295.1 | 278.4 | 296.3 | |||||||||
Diluted | 277.9 | 296.5 | 279.5 | 297.8 | |||||||||
See Condensed Notes to Interim Consolidated Financial Statements. |
DEERE & COMPANY CONDENSED CONSOLIDATED BALANCE SHEETS (In millions of dollars) Unaudited | |||||||||
April 28 | October 29 | April 30 | |||||||
2024 | 2023 | 2023 | |||||||
Assets | |||||||||
Cash and cash equivalents | $ | 5,553 | $ | 7,458 | $ | 5,267 | |||
Marketable securities | 1,094 | 946 | 856 | ||||||
Trade accounts and notes receivable – net | 8,880 | 7,739 | 9,971 | ||||||
Financing receivables – net | 45,278 | 43,673 | 38,954 | ||||||
Financing receivables securitized – net | 7,262 | 7,335 | 5,659 | ||||||
Other receivables | 2,535 | 2,623 | 2,593 | ||||||
Equipment on operating leases – net | 6,965 | 6,917 | 6,524 | ||||||
Inventories | 8,443 | 8,160 | 9,713 | ||||||
Property and equipment – net | 7,034 | 6,879 | 6,288 | ||||||
Goodwill | 3,936 | 3,900 | 3,963 | ||||||
Other intangible assets – net | 1,064 | 1,133 | 1,222 | ||||||
Retirement benefits | 3,056 | 3,007 | 3,519 | ||||||
Deferred income taxes | 1,936 | 1,814 | 1,308 | ||||||
Other assets | 2,592 | 2,503 | 2,510 | ||||||
Total Assets | $ | 105,628 | $ | 104,087 | $ | 98,347 | |||
Liabilities and Stockholders' Equity | |||||||||
Liabilities | |||||||||
... Short-term borrowings | $ | 17,699 | $ | 17,939 | $ | 17,109 | |||
Short-term securitization borrowings | 6,976 | 6,995 | 5,379 | ||||||
Accounts payable and accrued expenses | 14,609 | 16,130 | 14,716 | ||||||
Deferred income taxes | 491 | 520 | 511 | ||||||
Long-term borrowings | 40,962 | 38,477 | 35,611 | ||||||
Retirement benefits and other liabilities | 2,105 | 2,140 | 2,520 | ||||||
Total liabilities | 82,842 | 82,201 | 75,846 | ||||||
Redeemable noncontrolling interest | 98 | 97 | 102 | ||||||
Stockholders' Equity | |||||||||
Total Deere & Company stockholders' equity | 22,684 | 21,785 | 22,395 | ||||||
Noncontrolling interests | 4 | 4 | 4 | ||||||
Total stockholders' equity | 22,688 | 21,789 | 22,399 | ||||||
Total Liabilities and Stockholders' Equity | $ | 105,628 | $ | 104,087 | $ | 98,347 | |||
See Condensed Notes to Interim Consolidated Financial Statements. |
DEERE & COMPANY STATEMENTS OF CONSOLIDATED CASH FLOWS For the Six Months Ended April 28, 2024 and April 30, 2023 (In millions of dollars) Unaudited | ||||||
2024 | 2023 | |||||
Cash Flows from Operating Activities | ||||||
Net income | $ | 4,116 | $ | 4,815 | ||
Adjustments to reconcile net income to net cash provided by (used for) operating activities: | ||||||
Provision (credit) for credit losses | 131 | (89) | ||||
Provision for depreciation and amortization | 1,045 | 995 | ||||
Other non-cash adjustments (Note 1) | 173 | |||||
Share-based compensation expense | 104 | 54 | ||||
Credit for deferred income taxes | (120) | (377) | ||||
Changes in assets and liabilities: | ||||||
Receivables related to sales | (2,469) | (4,407) | ||||
Inventories | (409) | (982) | ||||
Accounts payable and accrued expenses | (1,300) | (313) | ||||
Accrued income taxes payable/receivable | (29) | (96) | ||||
Retirement benefits | (208) | (68) | ||||
Other | 83 | 148 | ||||
Net cash provided by (used for) operating activities | 944 | (147) | ||||
Cash Flows from Investing Activities | ||||||
Collections of receivables (excluding receivables related to sales) | 13,703 | 12,593 | ||||
Proceeds from maturities and sales of marketable securities | 200 | 98 | ||||
Proceeds from sales of equipment on operating leases | 1,011 | 993 | ||||
Cost of receivables acquired (excluding receivables related to sales) | (14,091) | (13,451) | ||||
Purchases of marketable securities | (432) | (188) | ||||
Purchases of property and equipment | (719) | (584) | ||||
Cost of equipment on operating leases acquired | (1,369) | (1,229) | ||||
Collateral on derivatives – net | 96 | 367 | ||||
Other | (69) | (93) | ||||
Net cash used for investing activities | (1,670) | (1,494) | ||||
Cash Flows from Financing Activities | ||||||
Net proceeds in short-term borrowings (original maturities three months or less) | 58 | 3,992 | ||||
Proceeds from borrowings issued (original maturities greater than three months) | 10,189 | 4,868 | ||||
Payments of borrowings (original maturities greater than three months) | (8,139) | (3,567) | ||||
Repurchases of common stock | (2,422) | (2,546) | ||||
Dividends paid | (796) | (697) | ||||
Other | (52) | (33) | ||||
Net cash provided by (used for) financing activities | (1,162) | 2,017 | ||||
Effect of Exchange Rate Changes on Cash, Cash Equivalents, and Restricted Cash | (5) | 70 | ||||
Net Increase (Decrease) in Cash, Cash Equivalents, and Restricted Cash | (1,893) | 446 | ||||
Cash, Cash Equivalents, and Restricted Cash at Beginning of Period | 7,620 | 4,941 | ||||
Cash, Cash Equivalents, and Restricted Cash at End of Period | $ | 5,727 | $ | 5,387 | ||
See Condensed Notes to Interim Consolidated Financial Statements. |
DEERE & COMPANY | |
Condensed Notes to Interim Consolidated Financial Statements | |
(In millions of dollars) Unaudited | |
(1) | In the second quarter of 2023, the company corrected the accounting treatment for financing incentives offered to John Deere dealers, which impacted the timing of expense recognition and the presentation of incentive costs in the consolidated financial statements. The cumulative effect of this correction, $173 million pretax ($135 million after-tax), was recorded in the second quarter of 2023 in "Selling, administrative and general expenses" by financial services. |
(2) | The consolidated financial statements represent the consolidation of all Deere & Company's subsidiaries. The supplemental consolidating data is presented for informational purposes. Transactions between the equipment operations and financial services have been eliminated to arrive at the consolidated financial statements. In the supplemental consolidating data in Note 3 to the financial statements, the "Equipment Operations" represents the enterprise without "Financial Services", which include the company's production and precision agriculture operations, small agriculture and turf operations, and construction and forestry operations, and other corporate assets, liabilities, revenues, and expenses not reflected within "Financial Services." |
DEERE & COMPANY (3) SUPPLEMENTAL CONSOLIDATING DATA STATEMENTS OF INCOME For the Three Months Ended April 28, 2024 and April 30, 2023 (In millions of dollars) Unaudited | ||||||||||||||||||||||||||
EQUIPMENT | FINANCIAL | |||||||||||||||||||||||||
OPERATIONS | SERVICES | ELIMINATIONS | CONSOLIDATED | |||||||||||||||||||||||
2024 | 2023 | 2024 | 2023 | 2024 | 2023 | 2024 | 2023 | |||||||||||||||||||
Net Sales and Revenues | ||||||||||||||||||||||||||
Net sales | $ | 13,610 | $ | 16,079 | $ | 13,610 | $ | 16,079 | ||||||||||||||||||
Finance and interest income | 129 | 121 | $ | 1,496 | $ | 1,206 | $ | (238) | $ | (248) | 1,387 | 1,079 | 1 | |||||||||||||
Other income | 198 | 185 | 92 | 91 | (52) | (47) | 238 | 229 | 2, 3 | |||||||||||||||||
Total | 13,937 | 16,385 | 1,588 | 1,297 | (290) | (295) | 15,235 | 17,387 | ||||||||||||||||||
Costs and Expenses | ||||||||||||||||||||||||||
Cost of sales | 9,164 | 10,737 | (7) | (7) | 9,157 | 10,730 | 4 | |||||||||||||||||||
Research and development expenses | 565 | 547 | 565 | 547 | ||||||||||||||||||||||
Selling, administrative and general expenses | 1,007 | 935 | 260 | 397 | (2) | (2) | 1,265 | 1,330 | 4 | |||||||||||||||||
Interest expense | 114 | 103 | 780 | 540 | (58) | (74) | 836 | 569 | 1 | |||||||||||||||||
Interest compensation to Financial Services | 180 | 174 | (180) | (174) | 1 | |||||||||||||||||||||
Other operating expenses | 1 | 85 | 337 | 316 | (43) | (38) | 295 | 363 | 3, 5 | |||||||||||||||||
Total | 11,031 | 12,581 | 1,377 | 1,253 | (290) | (295) | 12,118 | 13,539 | ||||||||||||||||||
Income before Income Taxes | 2,906 | 3,804 | 211 | 44 | 3,117 | 3,848 | ||||||||||||||||||||
Provision for income taxes | 700 | 974 | 51 | 17 | 751 | 991 | ||||||||||||||||||||
Income after Income Taxes | 2,206 | 2,830 | 160 | 27 | 2,366 | 2,857 | ||||||||||||||||||||
Equity in income of unconsolidated affiliates | 1 | 2 | 1 | 2 | 2 | |||||||||||||||||||||
Net Income | 2,206 | 2,831 | 162 | 28 | 2,368 | 2,859 | ||||||||||||||||||||
Less: Net loss attributable to noncontrolling interests | (2) | (1) | (2) | (1) | ||||||||||||||||||||||
Net Income Attributable to Deere & Company | $ | 2,208 | $ | 2,832 | $ | 162 | $ | 28 | $ | 2,370 | $ | 2,860 | ||||||||||||||
1 | Elimination of intercompany interest income and expense. |
2 | Elimination of Equipment Operations' margin from inventory transferred to equipment on operating leases. |
3 | Elimination of income and expense between Equipment Operations and Financial Services related to intercompany guarantees of investments in certain international markets and intercompany service revenues and expenses. |
4 | Elimination of intercompany service fees. |
5 | Elimination of Financial Services' lease depreciation expense related to inventory transferred to equipment on operating leases. |
DEERE & COMPANY SUPPLEMENTAL CONSOLIDATING DATA (Continued) STATEMENTS OF INCOME For the Six Months Ended April 28, 2024 and April 30, 2023 (In millions of dollars) Unaudited | ||||||||||||||||||||||||||
EQUIPMENT | FINANCIAL | |||||||||||||||||||||||||
OPERATIONS | SERVICES | ELIMINATIONS | CONSOLIDATED | |||||||||||||||||||||||
2024 | 2023 | 2024 | 2023 | 2024 | 2023 | 2024 | 2023 | |||||||||||||||||||
Net Sales and Revenues | ||||||||||||||||||||||||||
Net sales | $ | 24,097 | $ | 27,481 | $ | 24,097 | $ | 27,481 | ||||||||||||||||||
Finance and interest income | 285 | 234 | $ | 2,929 | $ | 2,274 | $ | (468) | $ | (435) | 2,746 | 2,073 | 1 | |||||||||||||
Other income | 487 | 417 | 211 | 268 | (121) | (201) | 577 | 484 | 2, 3 | |||||||||||||||||
Total | 24,869 | 28,132 | 3,140 | 2,542 | (589) | (636) | 27,420 | 30,038 | ||||||||||||||||||
Costs and Expenses | ||||||||||||||||||||||||||
Cost of sales | 16,371 | 18,675 | (14) | (12) | 16,357 | 18,663 | 4 | |||||||||||||||||||
Research and development expenses | 1,098 | 1,043 | 1,098 | 1,043 | ||||||||||||||||||||||
Selling, administrative and general expenses | 1,882 | 1,719 | 453 | 569 | (5) | (5) | 2,330 | 2,283 | 4 | |||||||||||||||||
Interest expense | 223 | 204 | 1,542 | 983 | (127) | (138) | 1,638 | 1,049 | 1 | |||||||||||||||||
Interest compensation to Financial Services | 341 | 297 | (341) | (297) | 1 | |||||||||||||||||||||
Other operating expenses | 91 | 137 | 675 | 707 | (102) | (184) | 664 | 660 | 3, 5 | |||||||||||||||||
Total | 20,006 | 22,075 | 2,670 | 2,259 | (589) | (636) | 22,087 | 23,698 | ||||||||||||||||||
Income before Income Taxes | 4,863 | 6,057 | 470 | 283 | 5,333 | 6,340 | ||||||||||||||||||||
Provision for income taxes | 1,117 | 1,455 | 103 | 73 | 1,220 | 1,528 | ||||||||||||||||||||
Income after Income Taxes | 3,746 | 4,602 | 367 | 210 | 4,113 | 4,812 | ||||||||||||||||||||
Equity in income of unconsolidated affiliates | 1 | 3 | 2 | 3 | 3 | |||||||||||||||||||||
Net Income | 3,746 | 4,603 | 370 | 212 | 4,116 | 4,815 | ||||||||||||||||||||
Less: Net loss attributable to noncontrolling interests | (5) | (4) | (5) | (4) | ||||||||||||||||||||||
Net Income Attributable to Deere & Company | $ | 3,751 | $ | 4,607 | $ | 370 | $ | 212 | $ | 4,121 | $ | 4,819 | ||||||||||||||
1 | Elimination of intercompany interest income and expense. |
2 | Elimination of Equipment Operations' margin from inventory transferred to equipment on operating leases. |
3 | Elimination of income and expense between Equipment Operations and Financial Services related to intercompany guarantees of investments in certain international markets and intercompany service revenues and expenses. |
4 | Elimination of intercompany service fees. |
5 | Elimination of Financial Services' lease depreciation expense related to inventory transferred to equipment on operating leases. |
DEERE & COMPANY SUPPLEMENTAL CONSOLIDATING DATA (Continued) CONDENSED BALANCE SHEETS (In millions of dollars) Unaudited | ||||||||||||||||||||||||||||||||||||||
EQUIPMENT | FINANCIAL | |||||||||||||||||||||||||||||||||||||
OPERATIONS | SERVICES | ELIMINATIONS | CONSOLIDATED | |||||||||||||||||||||||||||||||||||
Apr 28 | Oct 29 | Apr 30 | Apr 28 | Oct 29 | Apr 30 | Apr 28 | Oct 29 | Apr 30 | Apr 28 | Oct 29 | Apr 30 | |||||||||||||||||||||||||||
2024 | 2023 | 2023 | 2024 | 2023 | 2023 | 2024 | 2023 | 2023 | 2024 | 2023 | 2023 | |||||||||||||||||||||||||||
Assets | ||||||||||||||||||||||||||||||||||||||
Cash and cash equivalents | $ | 3,800 | $ | 5,720 | $ | 3,587 | $ | 1,753 | $ | 1,738 | $ | 1,680 | $ | 5,553 | $ | 7,458 | $ | 5,267 | ||||||||||||||||||||
Marketable securities | 148 | 104 | 14 | 946 | 842 | 842 | 1,094 | 946 | 856 | |||||||||||||||||||||||||||||
Receivables from Financial Services | 4,480 | 4,516 | 5,899 | $ | (4,480) | $ | (4,516) | $ | (5,899) | 6 | ||||||||||||||||||||||||||||
Trade accounts and notes receivable – net | 1,320 | 1,320 | 1,562 | 10,263 | 8,687 | 10,422 | (2,703) | (2,268) | (2,013) | 8,880 | 7,739 | 9,971 | 7 | |||||||||||||||||||||||||
Financing receivables – net | 80 | 64 | 54 | 45,198 | 43,609 | 38,900 | 45,278 | 43,673 | 38,954 | |||||||||||||||||||||||||||||
Financing receivables securitized – net | 1 | 7,262 | 7,335 | 5,658 | 7,262 | 7,335 | 5,659 | |||||||||||||||||||||||||||||||
Other receivables | 1,822 | 1,813 | 2,201 | 760 | 869 | 481 | (47) | (59) | (89) | 2,535 | 2,623 | 2,593 | 7 | |||||||||||||||||||||||||
Equipment on operating leases – net | 6,965 | 6,917 | 6,524 | 6,965 | 6,917 | 6,524 | ||||||||||||||||||||||||||||||||
Inventories | 8,443 | 8,160 | 9,713 | 8,443 | 8,160 | 9,713 | ||||||||||||||||||||||||||||||||
Property and equipment – net | 6,999 | 6,843 | 6,254 | 35 | 36 | 34 | 7,034 | 6,879 | 6,288 | |||||||||||||||||||||||||||||
Goodwill | 3,936 | 3,900 | 3,963 | 3,936 | 3,900 | 3,963 | ||||||||||||||||||||||||||||||||
Other intangible assets – net | 1,064 | 1,133 | 1,222 | 1,064 | 1,133 | 1,222 | ||||||||||||||||||||||||||||||||
Retirement benefits | 2,980 | 2,936 | 3,450 | 77 | 72 | 69 | (1) | (1) | 3,056 | 3,007 | 3,519 | 8 | ||||||||||||||||||||||||||
Deferred income taxes | 2,210 | 2,133 | 1,355 | 71 | 68 | 59 | (345) | (387) | (106) | 1,936 | 1,814 | 1,308 | 9 | |||||||||||||||||||||||||
Other assets | 2,105 | 1,948 | 1,961 | 504 | 559 | 564 | (17) | (4) | (15) | 2,592 | 2,503 | 2,510 | ||||||||||||||||||||||||||
Total Assets | $ | 39,387 | $ | 40,590 | $ | 41,236 | $ | 73,834 | $ | 70,732 | $ | 65,233 | $ | (7,593) | $ | (7,235) | $ | (8,122) | $ | 105,628 | $ | 104,087 | $ | 98,347 | ||||||||||||||
Liabilities and Stockholders' Equity | ||||||||||||||||||||||||||||||||||||||
Liabilities | ||||||||||||||||||||||||||||||||||||||
Short-term borrowings | $ | 1,055 | $ | 1,230 | $ | 1,755 | $ | 16,644 | $ | 16,709 | $ | 15,354 | $ | 17,699 | $ | 17,939 | $ | 17,109 | ||||||||||||||||||||
Short-term securitization borrowings | 6,976 | 6,995 | 5,379 | 6,976 | 6,995 | 5,379 | ||||||||||||||||||||||||||||||||
Payables to Equipment Operations | 4,480 | 4,516 | 5,899 | $ | (4,480) | $ | (4,516) | $ | (5,899) | 6 | ||||||||||||||||||||||||||||
Accounts payable and accrued expenses | 13,771 | 14,862 | 13,759 | 3,605 | 3,599 | 3,074 | (2,767) | (2,331) | (2,117) | 14,609 | 16,130 | 14,716 | 7 | |||||||||||||||||||||||||
Deferred income taxes | 421 | 452 | 402 | 415 | 455 | 215 | (345) | (387) | (106) | 491 | 520 | 511 | 9 | |||||||||||||||||||||||||
Long-term borrowings | 6,575 | 7,210 | 7,310 | 34,387 | 31,267 | 28,301 | 40,962 | 38,477 | 35,611 | |||||||||||||||||||||||||||||
Retirement benefits and other liabilities | 1,995 | 2,032 | 2,410 | 111 | 109 | 110 | (1) | (1) | 2,105 | 2,140 | 2,520 | 8 | ||||||||||||||||||||||||||
Total liabilities | 23,817 | 25,786 | 25,636 | 66,618 | 63,650 | 58,332 | (7,593) | (7,235) | (8,122) | 82,842 | 82,201 | 75,846 | ||||||||||||||||||||||||||
Redeemable noncontrolling interest | 98 | 97 | 102 | 98 | 97 | 102 | ||||||||||||||||||||||||||||||||
Stockholders' Equity | ||||||||||||||||||||||||||||||||||||||
Total Deere & Company stockholders' equity | 22,684 | 21,785 | 22,395 | 7,216 | 7,082 | 6,901 | (7,216) | (7,082) | (6,901) | 22,684 | 21,785 | 22,395 | 10 | |||||||||||||||||||||||||
Noncontrolling interests | 4 | 4 | 4 | 4 | 4 | 4 | ||||||||||||||||||||||||||||||||
Financial Services equity | (7,216) | (7,082) | (6,901) | 7,216 | 7,082 | 6,901 | 10 | |||||||||||||||||||||||||||||||
Adjusted total stockholders' equity | 15,472 | 14,707 | 15,498 | 7,216 | 7,082 | 6,901 | 22,688 | 21,789 | 22,399 | |||||||||||||||||||||||||||||
Total Liabilities and Stockholders' Equity | $ | 39,387 | $ | 40,590 | $ | 41,236 | $ | 73,834 | $ | 70,732 | $ | 65,233 | $ | (7,593) | $ | (7,235) | $ | (8,122) | $ | 105,628 | $ | 104,087 | $ | 98,347 | ||||||||||||||
6 | Elimination of receivables / payables between Equipment Operations and Financial Services. |
7 | Primarily reclassification of sales incentive accruals on receivables sold to Financial Services. |
8 | Reclassification of net pension assets / liabilities. |
9 | Reclassification of deferred tax assets / liabilities in the same taxing jurisdictions. |
10 | Elimination of Financial Services' equity. |
DEERE & COMPANY SUPPLEMENTAL CONSOLIDATING DATA (Continued) STATEMENTS OF CASH FLOWS For the Six Months Ended April 28, 2024 and April 30, 2023 (In millions of dollars) Unaudited | ||||||||||||||||||||||||||
EQUIPMENT | FINANCIAL | |||||||||||||||||||||||||
OPERATIONS | SERVICES | ELIMINATIONS | CONSOLIDATED | |||||||||||||||||||||||
2024 | 2023 | 2024 | 2023 | 2024 | 2023 | 2024 | 2023 | |||||||||||||||||||
Cash Flows from Operating Activities | ||||||||||||||||||||||||||
Net income | $ | 3,746 | $ | 4,603 | $ | 370 | $ | 212 | $ | 4,116 | $ | 4,815 | ||||||||||||||
Adjustments to reconcile net income to net cash provided by (used for) operating activities: | ||||||||||||||||||||||||||
Provision (credit) for credit losses | 10 | 4 | 121 | (93) | 131 | (89) | ||||||||||||||||||||
Provision for depreciation and amortization | 608 | 565 | 509 | 500 | $ | (72) | $ | (70) | 1,045 | 995 | 11 | |||||||||||||||
Other non-cash adjustments (Note 1) | 173 | 173 | ||||||||||||||||||||||||
Share-based compensation expense | 104 | 54 | 104 | 54 | 12 | |||||||||||||||||||||
Distributed earnings of Financial Services | 247 | 12 | (247) | (12) | 13 | |||||||||||||||||||||
Credit for deferred income taxes | (74) | (304) | (46) | (73) | (120) | (377) | ||||||||||||||||||||
Changes in assets and liabilities: | ||||||||||||||||||||||||||
Receivables related to sales | (58) | (255) | (2,411) | (4,152) | (2,469) | (4,407) | 14, 16 | |||||||||||||||||||
Inventories | (300) | (910) | (109) | (72) | (409) | (982) | 15 | |||||||||||||||||||
Accounts payable and accrued expenses | (1,012) | 161 | 147 | 243 | (435) | (717) | (1,300) | (313) | 16 | |||||||||||||||||
Accrued income taxes payable/receivable | (20) | (97) | (9) | 1 | (29) | (96) | ||||||||||||||||||||
Retirement benefits | (205) | (67) | (3) | (1) | (208) | (68) | ||||||||||||||||||||
Other | 89 | 54 | 65 | 103 | (71) | (9) | 83 | 148 | 11, 12, 15 | |||||||||||||||||
Net cash provided by (used for) operating activities | 3,031 | 3,766 | 1,154 | 1,065 | (3,241) | (4,978) | 944 | (147) | ||||||||||||||||||
Cash Flows from Investing Activities | ||||||||||||||||||||||||||
Collections of receivables (excluding receivables related to sales) | 14,175 | 13,169 | (472) | (576) | 13,703 | 12,593 | 14 | |||||||||||||||||||
Proceeds from maturities and sales of marketable securities | 58 | 62 | 142 | 36 | 200 | 98 | ||||||||||||||||||||
Proceeds from sales of equipment on operating leases | 1,011 | 993 | 1,011 | 993 | ||||||||||||||||||||||
Cost of receivables acquired (excluding receivables related to sales) | (14,238) | (13,584) | 147 | 133 | (14,091) | (13,451) | 14 | |||||||||||||||||||
Purchases of marketable securities | (226) | (21) | (206) | (167) | (432) | (188) | ||||||||||||||||||||
Purchases of property and equipment | (718) | (583) | (1) | (1) | (719) | (584) | ||||||||||||||||||||
Cost of equipment on operating leases acquired | (1,516) | (1,327) | 147 | 98 | (1,369) | (1,229) | 15 | |||||||||||||||||||
Decrease (increase) in investment in Financial Services | 10 | (799) | (10) | 799 | 17 | |||||||||||||||||||||
Increase in trade and wholesale receivables | (3,171) | (5,310) | 3,171 | 5,310 | 14 | |||||||||||||||||||||
Collateral on derivatives – net | 96 | 367 | 96 | 367 | ||||||||||||||||||||||
Other | (68) | (119) | (2) | 25 | 1 | 1 | (69) | (93) | ||||||||||||||||||
Net cash used for investing activities | (944) | (1,460) | (3,710) | (5,799) | 2,984 | 5,765 | (1,670) | (1,494) | ||||||||||||||||||
Cash Flows from Financing Activities | ||||||||||||||||||||||||||
Net proceeds (payments) in short-term borrowings (original maturities three months or less) | 189 | (225) | (131) | 4,217 | 58 | 3,992 | ||||||||||||||||||||
Change in intercompany receivables/payables | 31 | 932 | (31) | (932) | ||||||||||||||||||||||
Proceeds from borrowings issued (original maturities greater than three months) | 34 | 41 | 10,155 | 4,827 | 10,189 | 4,868 | ||||||||||||||||||||
Payments of borrowings (original maturities greater than three months) | (1,012) | (47) | (7,127) | (3,520) | (8,139) | (3,567) | ||||||||||||||||||||
Repurchases of common stock | (2,422) | (2,546) | (2,422) | (2,546) | ||||||||||||||||||||||
Capital Investment from Equipment Operations | (10) | 799 | 10 | (799) | 17 | |||||||||||||||||||||
Dividends paid | (796) | (697) | (247) | (12) | 247 | 12 | (796) | (697) | 13 | |||||||||||||||||
Other | (27) | (5) | (25) | (28) | (52) | (33) | ||||||||||||||||||||
Net cash provided by (used for) financing activities | (4,003) | (2,547) | 2,584 | 5,351 | 257 | (787) | (1,162) | 2,017 | ||||||||||||||||||
Effect of Exchange Rate Changes on Cash, Cash Equivalents, and Restricted Cash | 62 | (5) | 8 | (5) | 70 | |||||||||||||||||||||
Net Increase (Decrease) in Cash, Cash Equivalents, and Restricted Cash | (1,916) | (179) | 23 | 625 | (1,893) | 446 | ||||||||||||||||||||
Cash, Cash Equivalents, and Restricted Cash at Beginning of Period | 5,755 | 3,781 | 1,865 | 1,160 | 7,620 | 4,941 | ||||||||||||||||||||
Cash, Cash Equivalents, and Restricted Cash at End of Period | $ | 3,839 | $ | 3,602 | $ | 1,888 | $ | 1,785 | $ | 5,727 | $ | 5,387 | ||||||||||||||
11 | Elimination of depreciation on leases related to inventory transferred to equipment on operating leases. |
12 | Reclassification of share-based compensation expense. |
13 | Elimination of dividends from Financial Services to the Equipment Operations, which are included in the Equipment Operations operating activities. |
14 | Primarily reclassification of receivables related to the sale of equipment. |
15 | Reclassification of direct lease agreements with retail customers. |
16 | Reclassification of sales incentive accruals on receivables sold to Financial Services. |
17 | Elimination of change in investment from Equipment Operations to Financial Services. |

View original content to download multimedia:https://www.prnewswire.com/news-releases/deere-reports-second-quarter-net-income-of-2-370-billion-302147595.html
SOURCE John Deere Company
