
 Yahoo Finance
 Del Monte Pacific (SGX:D03) shareholders have endured a 47% loss from investing in the stock a year ago
Passive investing in an index fund is a good way to ensure your own returns roughly match the overall market. When you buy individual stocks, you can make higher profits, but you also face the risk of under-performance. Unfortunately the Del Monte Pacific Limited (SGX:D03) share price slid 48% over twelve months. That's well below the market decline of 0.9%. Longer term investors have fared much better, since the share price is up 29% in three years.
So let's have a look and see if the longer term performance of the company has been in line with the underlying business' progress.
View our latest analysis for Del Monte Pacific
In his essay The Superinvestors of Graham-and-Doddsville Warren Buffett described how share prices do not always rationally reflect the value of a business. One flawed but reasonable way to assess how sentiment around a company has changed is to compare the earnings per share (EPS) with the share price.
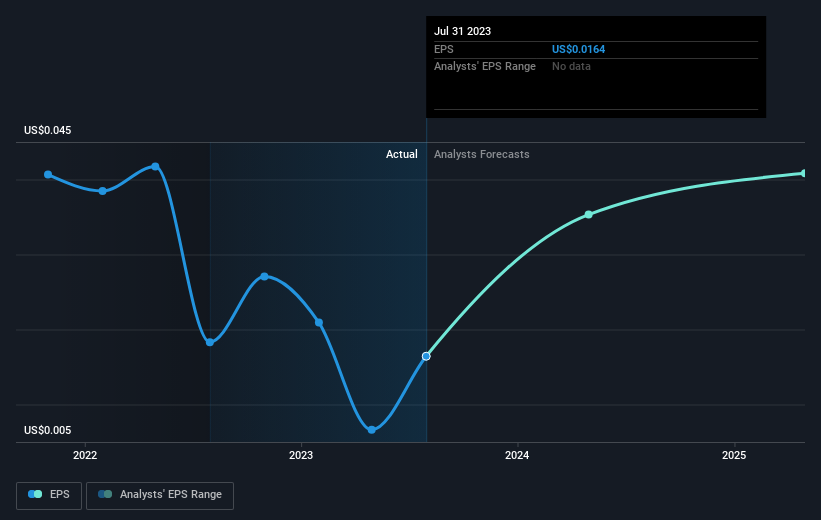
Unfortunately Del Monte Pacific reported an EPS drop of 10% for the last year. The share price decline of 48% is actually more than the EPS drop. Unsurprisingly, given the lack of EPS growth, the market seems to be more cautious about the stock. The less favorable sentiment is reflected in its current P/E ratio of 7.16.
You can see how EPS has changed over time in the image below (click on the chart to see the exact values).
We know that Del Monte Pacific has improved its bottom line over the last three years, but what does the future have in store? Take a more thorough look at Del Monte Pacific's financial health with this free report on its balance sheet.
A Different Perspective
While the broader market lost about 0.9% in the twelve months, Del Monte Pacific shareholders did even worse, losing 47% (even including dividends). However, it could simply be that the share price has been impacted by broader market jitters. It might be worth keeping an eye on the fundamentals, in case there's a good opportunity. On the bright side, long term shareholders have made money, with a gain of 6% per year over half a decade. It could be that the recent sell-off is an opportunity, so it may be worth checking the fundamental data for signs of a long term growth trend. I find it very interesting to look at share price over the long term as a proxy for business performance. But to truly gain insight, we need to consider other information, too. For instance, we've identified 2 warning signs for Del Monte Pacific (1 can't be ignored) that you should be aware of.
For those who like to find winning investments this free list of growing companies with recent insider purchasing, could be just the ticket.
Please note, the market returns quoted in this article reflect the market weighted average returns of stocks that currently trade on Singaporean exchanges.
Have feedback on this article? Concerned about the content? Get in touch with us directly. Alternatively, email editorial-team (at) simplywallst.com.
This article by Simply Wall St is general in nature. We provide commentary based on historical data and analyst forecasts only using an unbiased methodology and our articles are not intended to be financial advice. It does not constitute a recommendation to buy or sell any stock, and does not take account of your objectives, or your financial situation. We aim to bring you long-term focused analysis driven by fundamental data. Note that our analysis may not factor in the latest price-sensitive company announcements or qualitative material. Simply Wall St has no position in any stocks mentioned.
