
 Yahoo Finance
 Despite Its High P/E Ratio, Is Hansen Technologies Limited (ASX:HSN) Still Undervalued?

The goal of this article is to teach you how to use price to earnings ratios (P/E ratios). We'll look at Hansen Technologies Limited's (ASX:HSN) P/E ratio and reflect on what it tells us about the company's share price. Hansen Technologies has a P/E ratio of 32.40, based on the last twelve months. That is equivalent to an earnings yield of about 3.1%.
Check out our latest analysis for Hansen Technologies
How Do You Calculate A P/E Ratio?
The formula for price to earnings is:
Price to Earnings Ratio = Share Price ÷ Earnings per Share (EPS)
Or for Hansen Technologies:
P/E of 32.40 = A$3.53 ÷ A$0.11 (Based on the trailing twelve months to June 2019.)
Is A High Price-to-Earnings Ratio Good?
A higher P/E ratio means that investors are paying a higher price for each A$1 of company earnings. That isn't a good or a bad thing on its own, but a high P/E means that buyers have a higher opinion of the business's prospects, relative to stocks with a lower P/E.
Does Hansen Technologies Have A Relatively High Or Low P/E For Its Industry?
One good way to get a quick read on what market participants expect of a company is to look at its P/E ratio. The image below shows that Hansen Technologies has a P/E ratio that is roughly in line with the software industry average (31.5).
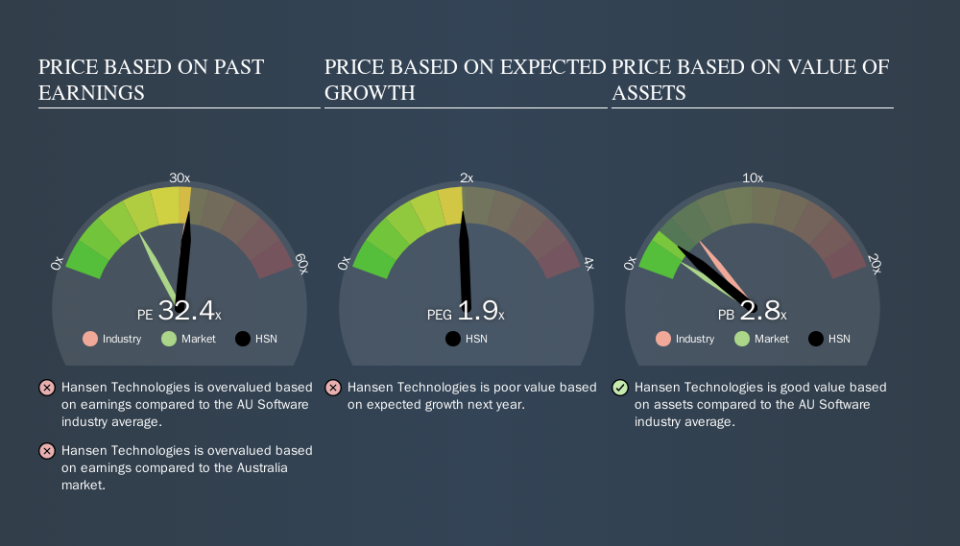
Hansen Technologies's P/E tells us that market participants think its prospects are roughly in line with its industry. If the company has better than average prospects, then the market might be underestimating it. I would further inform my view by checking insider buying and selling., among other things.
How Growth Rates Impact P/E Ratios
When earnings fall, the 'E' decreases, over time. Therefore, even if you pay a low multiple of earnings now, that multiple will become higher in the future. So while a stock may look cheap based on past earnings, it could be expensive based on future earnings.
Hansen Technologies saw earnings per share decrease by 26% last year. But over the longer term (5 years) earnings per share have increased by 3.4%. And over the longer term (3 years) earnings per share have decreased 9.5% annually. This could justify a low P/E.
A Limitation: P/E Ratios Ignore Debt and Cash In The Bank
It's important to note that the P/E ratio considers the market capitalization, not the enterprise value. That means it doesn't take debt or cash into account. The exact same company would hypothetically deserve a higher P/E ratio if it had a strong balance sheet, than if it had a weak one with lots of debt, because a cashed up company can spend on growth.
Such spending might be good or bad, overall, but the key point here is that you need to look at debt to understand the P/E ratio in context.
So What Does Hansen Technologies's Balance Sheet Tell Us?
Net debt totals 21% of Hansen Technologies's market cap. It would probably deserve a higher P/E ratio if it was net cash, since it would have more options for growth.
The Bottom Line On Hansen Technologies's P/E Ratio
Hansen Technologies trades on a P/E ratio of 32.4, which is above its market average of 17.9. With a bit of debt, but a lack of recent growth, it's safe to say the market is expecting improved profit performance from the company, in the next few years.
Investors have an opportunity when market expectations about a stock are wrong. People often underestimate remarkable growth -- so investors can make money when fast growth is not fully appreciated. So this free report on the analyst consensus forecasts could help you make a master move on this stock.
Of course, you might find a fantastic investment by looking at a few good candidates. So take a peek at this free list of companies with modest (or no) debt, trading on a P/E below 20.
We aim to bring you long-term focused research analysis driven by fundamental data. Note that our analysis may not factor in the latest price-sensitive company announcements or qualitative material.
If you spot an error that warrants correction, please contact the editor at editorial-team@simplywallst.com. This article by Simply Wall St is general in nature. It does not constitute a recommendation to buy or sell any stock, and does not take account of your objectives, or your financial situation. Simply Wall St has no position in the stocks mentioned. Thank you for reading.
