
 Yahoo Finance
 Despite Its High P/E Ratio, Is Smith & Nephew plc (LON:SN.) Still Undervalued?

Want to participate in a short research study? Help shape the future of investing tools and you could win a $250 gift card!
This article is for investors who would like to improve their understanding of price to earnings ratios (P/E ratios). To keep it practical, we'll show how Smith & Nephew plc's (LON:SN.) P/E ratio could help you assess the value on offer. Looking at earnings over the last twelve months, Smith & Nephew has a P/E ratio of 28.53. In other words, at today's prices, investors are paying £28.53 for every £1 in prior year profit.
See our latest analysis for Smith & Nephew
How Do I Calculate Smith & Nephew's Price To Earnings Ratio?
The formula for price to earnings is:
Price to Earnings Ratio = Share Price (in reporting currency) ÷ Earnings per Share (EPS)
Or for Smith & Nephew:
P/E of 28.53 = $21.67 (Note: this is the share price in the reporting currency, namely, USD ) ÷ $0.76 (Based on the year to December 2018.)
Is A High Price-to-Earnings Ratio Good?
A higher P/E ratio implies that investors pay a higher price for the earning power of the business. That isn't necessarily good or bad, but a high P/E implies relatively high expectations of what a company can achieve in the future.
How Growth Rates Impact P/E Ratios
Probably the most important factor in determining what P/E a company trades on is the earnings growth. That's because companies that grow earnings per share quickly will rapidly increase the 'E' in the equation. And in that case, the P/E ratio itself will drop rather quickly. Then, a lower P/E should attract more buyers, pushing the share price up.
Smith & Nephew shrunk earnings per share by 13% over the last year. But EPS is up 4.2% over the last 5 years.
How Does Smith & Nephew's P/E Ratio Compare To Its Peers?
We can get an indication of market expectations by looking at the P/E ratio. You can see in the image below that the average P/E (28.5) for companies in the medical equipment industry is roughly the same as Smith & Nephew's P/E.
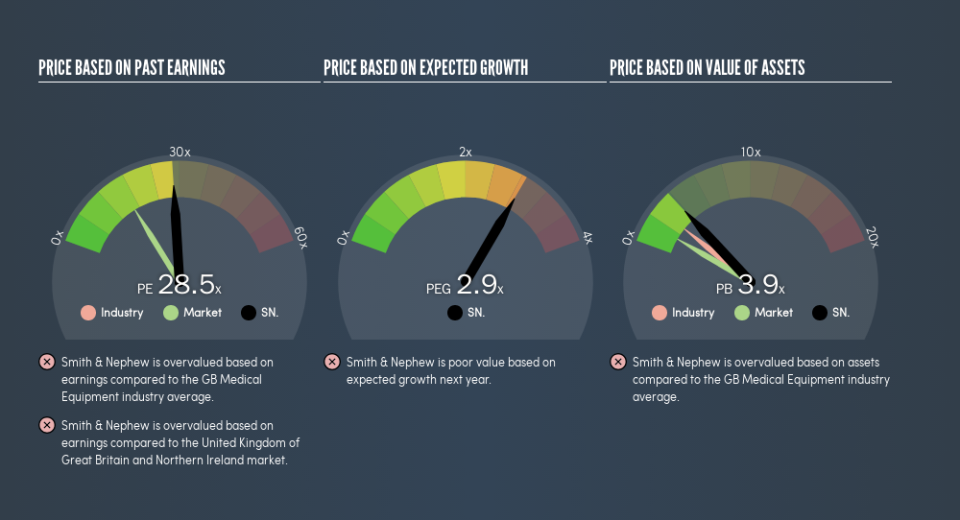
Its P/E ratio suggests that Smith & Nephew shareholders think that in the future it will perform about the same as other companies in its industry classification. So if Smith & Nephew actually outperforms its peers going forward, that should be a positive for the share price. Further research into factors such as insider buying and selling, could help you form your own view on whether that is likely.
A Limitation: P/E Ratios Ignore Debt and Cash In The Bank
Don't forget that the P/E ratio considers market capitalization. So it won't reflect the advantage of cash, or disadvantage of debt. In theory, a company can lower its future P/E ratio by using cash or debt to invest in growth.
While growth expenditure doesn't always pay off, the point is that it is a good option to have; but one that the P/E ratio ignores.
Is Debt Impacting Smith & Nephew's P/E?
Net debt totals just 5.8% of Smith & Nephew's market cap. It would probably trade on a higher P/E ratio if it had a lot of cash, but I doubt it is having a big impact.
The Verdict On Smith & Nephew's P/E Ratio
Smith & Nephew has a P/E of 28.5. That's higher than the average in the GB market, which is 16.4. With a bit of debt, but a lack of recent growth, it's safe to say the market is expecting improved profit performance from the company, in the next few years.
Investors should be looking to buy stocks that the market is wrong about. People often underestimate remarkable growth -- so investors can make money when fast growth is not fully appreciated. So this free visualization of the analyst consensus on future earnings could help you make the right decision about whether to buy, sell, or hold.
Of course, you might find a fantastic investment by looking at a few good candidates. So take a peek at this free list of companies with modest (or no) debt, trading on a P/E below 20.
We aim to bring you long-term focused research analysis driven by fundamental data. Note that our analysis may not factor in the latest price-sensitive company announcements or qualitative material.
If you spot an error that warrants correction, please contact the editor at editorial-team@simplywallst.com. This article by Simply Wall St is general in nature. It does not constitute a recommendation to buy or sell any stock, and does not take account of your objectives, or your financial situation. Simply Wall St has no position in the stocks mentioned. Thank you for reading.
