
 Yahoo Finance
 Despite Its High P/E Ratio, Is artnet AG (FRA:ART) Still Undervalued?

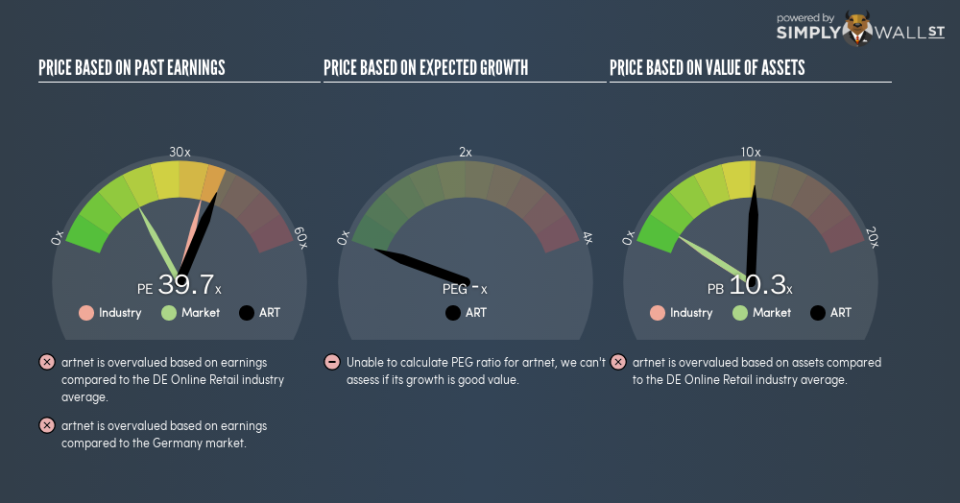
This article is written for those who want to get better at using price to earnings ratios (P/E ratios). We’ll look at artnet AG’s (FRA:ART) P/E ratio and reflect on what it tells us about the company’s share price. Based on the last twelve months, artnet’s P/E ratio is 39.65. That means that at current prices, buyers pay €39.65 for every €1 in trailing yearly profits.
View our latest analysis for artnet
Want to help shape the future of investing tools? Participate in a short research study and receive a 6-month subscription to the award winning Simply Wall St research tool (valued at $60)!
How Do I Calculate A Price To Earnings Ratio?
The formula for price to earnings is:
Price to Earnings Ratio = Price per Share ÷ Earnings per Share (EPS)
Or for artnet:
P/E of 39.65 = €3.48 ÷ €0.088 (Based on the year to June 2018.)
Is A High P/E Ratio Good?
A higher P/E ratio means that investors are paying a higher price for each €1 of company earnings. That isn’t necessarily good or bad, but a high P/E implies relatively high expectations of what a company can achieve in the future.
How Growth Rates Impact P/E Ratios
P/E ratios primarily reflect market expectations around earnings growth rates. Earnings growth means that in the future the ‘E’ will be higher. That means even if the current P/E is high, it will reduce over time if the share price stays flat. A lower P/E should indicate the stock is cheap relative to others — and that may attract buyers.
artnet saw earnings per share decrease by 7.3% last year. But over the longer term (5 years) earnings per share have increased by 39%.
How Does artnet’s P/E Ratio Compare To Its Peers?
The P/E ratio essentially measures market expectations of a company. As you can see below artnet has a P/E ratio that is fairly close for the average for the online retail industry, which is 37.7.
Its P/E ratio suggests that artnet shareholders think that in the future it will perform about the same as other companies in its industry classification. If the company has better than average prospects, then the market might be underestimating it. Further research into factors such asmanagement tenure, could help you form your own view on whether that is likely.
A Limitation: P/E Ratios Ignore Debt and Cash In The Bank
It’s important to note that the P/E ratio considers the market capitalization, not the enterprise value. Thus, the metric does not reflect cash or debt held by the company. In theory, a company can lower its future P/E ratio by using cash or debt to invest in growth.
Such expenditure might be good or bad, in the long term, but the point here is that the balance sheet is not reflected by this ratio.
How Does artnet’s Debt Impact Its P/E Ratio?
Since artnet holds net cash of €839k, it can spend on growth, justifying a higher P/E ratio than otherwise.
The Verdict On artnet’s P/E Ratio
artnet’s P/E is 39.7 which is above average (17.7) in the DE market. Falling earnings per share is probably keeping traditional value investors away, but the relatively strong balance sheet will allow the company time to invest in growth. Clearly, the high P/E indicates shareholders think it will!
Investors have an opportunity when market expectations about a stock are wrong. People often underestimate remarkable growth — so investors can make money when fast growth is not fully appreciated. Although we don’t have analyst forecasts, shareholders might want to examine this detailed historical graph of earnings, revenue and cash flow.
You might be able to find a better buy than artnet. If you want a selection of possible winners, check out this free list of interesting companies that trade on a P/E below 20 (but have proven they can grow earnings).
To help readers see past the short term volatility of the financial market, we aim to bring you a long-term focused research analysis purely driven by fundamental data. Note that our analysis does not factor in the latest price-sensitive company announcements.
The author is an independent contributor and at the time of publication had no position in the stocks mentioned. For errors that warrant correction please contact the editor at editorial-team@simplywallst.com.
