
 Yahoo Finance
 Despite Its High P/E Ratio, Is Imperial Brands PLC (LON:IMB) Still Undervalued?

Today, we'll introduce the concept of the P/E ratio for those who are learning about investing. To keep it practical, we'll show how Imperial Brands PLC's (LON:IMB) P/E ratio could help you assess the value on offer. Imperial Brands has a price to earnings ratio of 18.41, based on the last twelve months. That means that at current prices, buyers pay £18.41 for every £1 in trailing yearly profits.
Check out our latest analysis for Imperial Brands
How Do You Calculate Imperial Brands's P/E Ratio?
The formula for price to earnings is:
Price to Earnings Ratio = Share Price ÷ Earnings per Share (EPS)
Or for Imperial Brands:
P/E of 18.41 = GBP19.51 ÷ GBP1.06 (Based on the year to September 2019.)
Is A High Price-to-Earnings Ratio Good?
The higher the P/E ratio, the higher the price tag of a business, relative to its trailing earnings. That is not a good or a bad thing per se, but a high P/E does imply buyers are optimistic about the future.
How Does Imperial Brands's P/E Ratio Compare To Its Peers?
We can get an indication of market expectations by looking at the P/E ratio. You can see in the image below that the average P/E (10.3) for companies in the tobacco industry is lower than Imperial Brands's P/E.
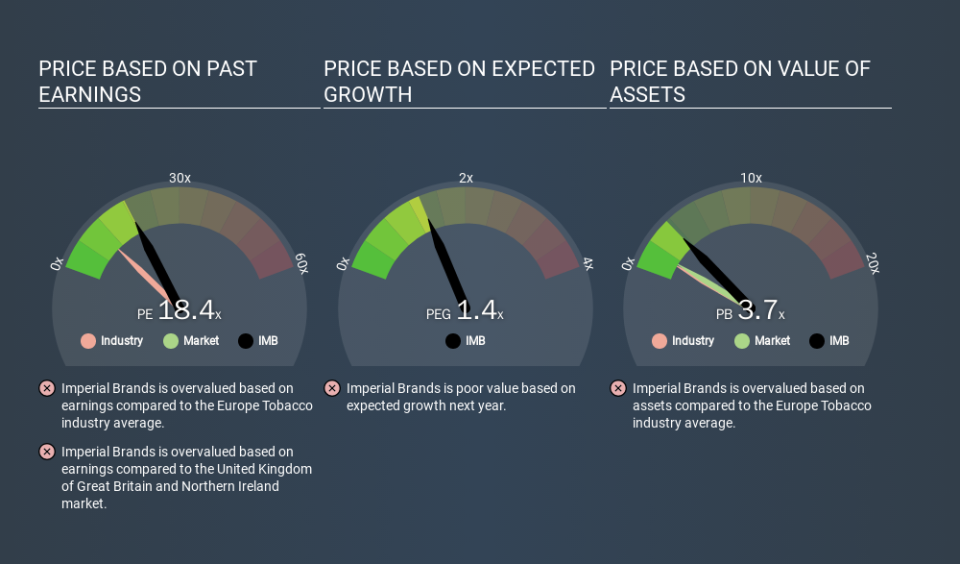
Its relatively high P/E ratio indicates that Imperial Brands shareholders think it will perform better than other companies in its industry classification. The market is optimistic about the future, but that doesn't guarantee future growth. So further research is always essential. I often monitor director buying and selling.
How Growth Rates Impact P/E Ratios
Earnings growth rates have a big influence on P/E ratios. If earnings are growing quickly, then the 'E' in the equation will increase faster than it would otherwise. That means unless the share price increases, the P/E will reduce in a few years. And as that P/E ratio drops, the company will look cheap, unless its share price increases.
Imperial Brands's earnings per share fell by 26% in the last twelve months. But over the longer term (3 years), earnings per share have increased by 17%. And over the longer term (5 years) earnings per share have decreased 6.5% annually. This might lead to muted expectations.
A Limitation: P/E Ratios Ignore Debt and Cash In The Bank
It's important to note that the P/E ratio considers the market capitalization, not the enterprise value. Thus, the metric does not reflect cash or debt held by the company. Hypothetically, a company could reduce its future P/E ratio by spending its cash (or taking on debt) to achieve higher earnings.
Spending on growth might be good or bad a few years later, but the point is that the P/E ratio does not account for the option (or lack thereof).
So What Does Imperial Brands's Balance Sheet Tell Us?
Net debt totals 62% of Imperial Brands's market cap. This is enough debt that you'd have to make some adjustments before using the P/E ratio to compare it to a company with net cash.
The Verdict On Imperial Brands's P/E Ratio
Imperial Brands's P/E is 18.4 which is about average (18.2) in the GB market. With significant debt and no EPS growth last year, the P/E suggests shareholders are expecting higher profit in the future.
Investors have an opportunity when market expectations about a stock are wrong. If the reality for a company is better than it expects, you can make money by buying and holding for the long term. So this free visualization of the analyst consensus on future earnings could help you make the right decision about whether to buy, sell, or hold.
Of course, you might find a fantastic investment by looking at a few good candidates. So take a peek at this free list of companies with modest (or no) debt, trading on a P/E below 20.
If you spot an error that warrants correction, please contact the editor at editorial-team@simplywallst.com. This article by Simply Wall St is general in nature. It does not constitute a recommendation to buy or sell any stock, and does not take account of your objectives, or your financial situation. Simply Wall St has no position in the stocks mentioned.
We aim to bring you long-term focused research analysis driven by fundamental data. Note that our analysis may not factor in the latest price-sensitive company announcements or qualitative material. Thank you for reading.
