
 Yahoo Finance
 Despite Its High P/E Ratio, Is Koninklijke DSM N.V. (AMS:DSM) Still Undervalued?

Want to participate in a short research study? Help shape the future of investing tools and you could win a $250 gift card!
This article is written for those who want to get better at using price to earnings ratios (P/E ratios). We'll look at Koninklijke DSM N.V.'s (AMS:DSM) P/E ratio and reflect on what it tells us about the company's share price. Koninklijke DSM has a price to earnings ratio of 19.59, based on the last twelve months. That means that at current prices, buyers pay €19.59 for every €1 in trailing yearly profits.
Check out our latest analysis for Koninklijke DSM
How Do You Calculate Koninklijke DSM's P/E Ratio?
The formula for P/E is:
Price to Earnings Ratio = Price per Share ÷ Earnings per Share (EPS)
Or for Koninklijke DSM:
P/E of 19.59 = €104.15 ÷ €5.32 (Based on the trailing twelve months to March 2019.)
Is A High P/E Ratio Good?
The higher the P/E ratio, the higher the price tag of a business, relative to its trailing earnings. That isn't necessarily good or bad, but a high P/E implies relatively high expectations of what a company can achieve in the future.
How Growth Rates Impact P/E Ratios
Generally speaking the rate of earnings growth has a profound impact on a company's P/E multiple. When earnings grow, the 'E' increases, over time. And in that case, the P/E ratio itself will drop rather quickly. So while a stock may look expensive based on past earnings, it could be cheap based on future earnings.
Koninklijke DSM's earnings per share fell by 52% in the last twelve months. But EPS is up 38% over the last 5 years.
Does Koninklijke DSM Have A Relatively High Or Low P/E For Its Industry?
We can get an indication of market expectations by looking at the P/E ratio. The image below shows that Koninklijke DSM has a P/E ratio that is roughly in line with the chemicals industry average (19.6).
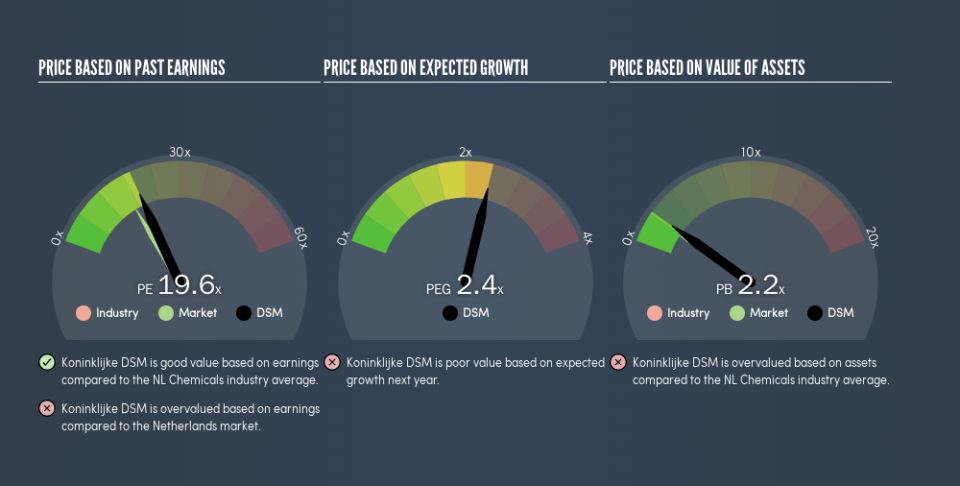
Koninklijke DSM's P/E tells us that market participants think its prospects are roughly in line with its industry. If the company has better than average prospects, then the market might be underestimating it. Checking factors such as the tenure of the board and management could help you form your own view on if that will happen.
Don't Forget: The P/E Does Not Account For Debt or Bank Deposits
One drawback of using a P/E ratio is that it considers market capitalization, but not the balance sheet. Thus, the metric does not reflect cash or debt held by the company. Theoretically, a business can improve its earnings (and produce a lower P/E in the future) by investing in growth. That means taking on debt (or spending its cash).
Such spending might be good or bad, overall, but the key point here is that you need to look at debt to understand the P/E ratio in context.
How Does Koninklijke DSM's Debt Impact Its P/E Ratio?
Koninklijke DSM's net debt is 2.1% of its market cap. It would probably trade on a higher P/E ratio if it had a lot of cash, but I doubt it is having a big impact.
The Bottom Line On Koninklijke DSM's P/E Ratio
Koninklijke DSM has a P/E of 19.6. That's higher than the average in the NL market, which is 16.8. With modest debt but no EPS growth in the last year, it's fair to say the P/E implies some optimism about future earnings, from the market.
Investors should be looking to buy stocks that the market is wrong about. If the reality for a company is better than it expects, you can make money by buying and holding for the long term. So this free visual report on analyst forecasts could hold the key to an excellent investment decision.
Of course, you might find a fantastic investment by looking at a few good candidates. So take a peek at this free list of companies with modest (or no) debt, trading on a P/E below 20.
We aim to bring you long-term focused research analysis driven by fundamental data. Note that our analysis may not factor in the latest price-sensitive company announcements or qualitative material.
If you spot an error that warrants correction, please contact the editor at editorial-team@simplywallst.com. This article by Simply Wall St is general in nature. It does not constitute a recommendation to buy or sell any stock, and does not take account of your objectives, or your financial situation. Simply Wall St has no position in the stocks mentioned. Thank you for reading.