
 Yahoo Finance
 Despite Its High P/E Ratio, Is Endava plc (NYSE:DAVA) Still Undervalued?

Today, we'll introduce the concept of the P/E ratio for those who are learning about investing. To keep it practical, we'll show how Endava plc's (NYSE:DAVA) P/E ratio could help you assess the value on offer. Based on the last twelve months, Endava's P/E ratio is 52.26. That is equivalent to an earnings yield of about 1.9%.
See our latest analysis for Endava
How Do I Calculate A Price To Earnings Ratio?
The formula for price to earnings is:
Price to Earnings Ratio = Share Price (in reporting currency) ÷ Earnings per Share (EPS)
Or for Endava:
P/E of 52.26 = GBP37.23 (Note: this is the share price in the reporting currency, namely, GBP ) ÷ GBP0.71 (Based on the trailing twelve months to September 2019.)
Is A High Price-to-Earnings Ratio Good?
A higher P/E ratio implies that investors pay a higher price for the earning power of the business. That isn't necessarily good or bad, but a high P/E implies relatively high expectations of what a company can achieve in the future.
How Does Endava's P/E Ratio Compare To Its Peers?
The P/E ratio essentially measures market expectations of a company. The image below shows that Endava has a higher P/E than the average (33.0) P/E for companies in the it industry.
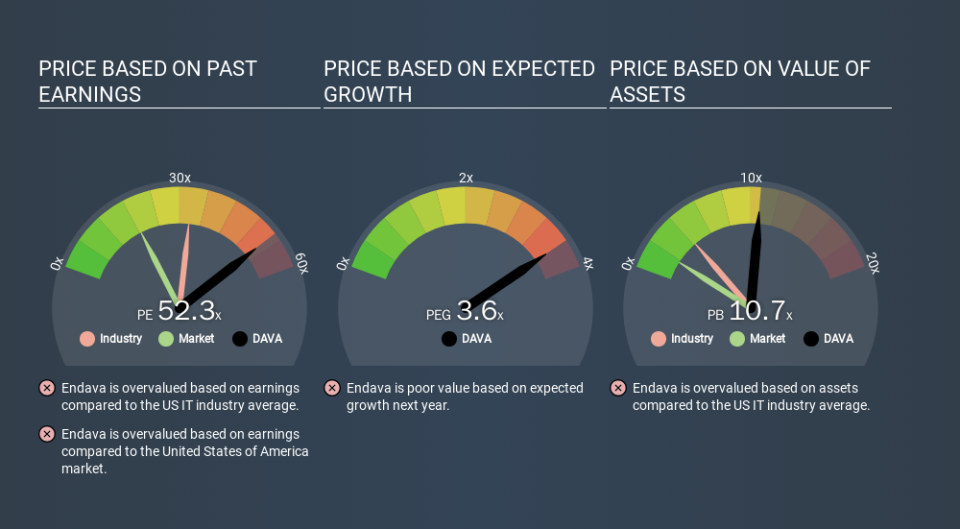
Its relatively high P/E ratio indicates that Endava shareholders think it will perform better than other companies in its industry classification. Shareholders are clearly optimistic, but the future is always uncertain. So investors should delve deeper. I like to check if company insiders have been buying or selling.
How Growth Rates Impact P/E Ratios
P/E ratios primarily reflect market expectations around earnings growth rates. If earnings are growing quickly, then the 'E' in the equation will increase faster than it would otherwise. Therefore, even if you pay a high multiple of earnings now, that multiple will become lower in the future. So while a stock may look expensive based on past earnings, it could be cheap based on future earnings.
Endava's 105% EPS improvement over the last year was like bamboo growth after rain; rapid and impressive. The cherry on top is that the five year growth rate was an impressive 31% per year. With that kind of growth rate we would generally expect a high P/E ratio.
Don't Forget: The P/E Does Not Account For Debt or Bank Deposits
It's important to note that the P/E ratio considers the market capitalization, not the enterprise value. Thus, the metric does not reflect cash or debt held by the company. Theoretically, a business can improve its earnings (and produce a lower P/E in the future) by investing in growth. That means taking on debt (or spending its cash).
While growth expenditure doesn't always pay off, the point is that it is a good option to have; but one that the P/E ratio ignores.
So What Does Endava's Balance Sheet Tell Us?
The extra options and safety that comes with Endava's UK£84m net cash position means that it deserves a higher P/E than it would if it had a lot of net debt.
The Bottom Line On Endava's P/E Ratio
Endava's P/E is 52.3 which is above average (18.5) in its market. The excess cash it carries is the gravy on top its fast EPS growth. So based on this analysis we'd expect Endava to have a high P/E ratio.
Investors should be looking to buy stocks that the market is wrong about. People often underestimate remarkable growth -- so investors can make money when fast growth is not fully appreciated. So this free visual report on analyst forecasts could hold the key to an excellent investment decision.
You might be able to find a better buy than Endava. If you want a selection of possible winners, check out this free list of interesting companies that trade on a P/E below 20 (but have proven they can grow earnings).
If you spot an error that warrants correction, please contact the editor at editorial-team@simplywallst.com. This article by Simply Wall St is general in nature. It does not constitute a recommendation to buy or sell any stock, and does not take account of your objectives, or your financial situation. Simply Wall St has no position in the stocks mentioned.
We aim to bring you long-term focused research analysis driven by fundamental data. Note that our analysis may not factor in the latest price-sensitive company announcements or qualitative material. Thank you for reading.
