
 Yahoo Finance
 Despite Its High P/E Ratio, Is Williams-Sonoma, Inc. (NYSE:WSM) Still Undervalued?

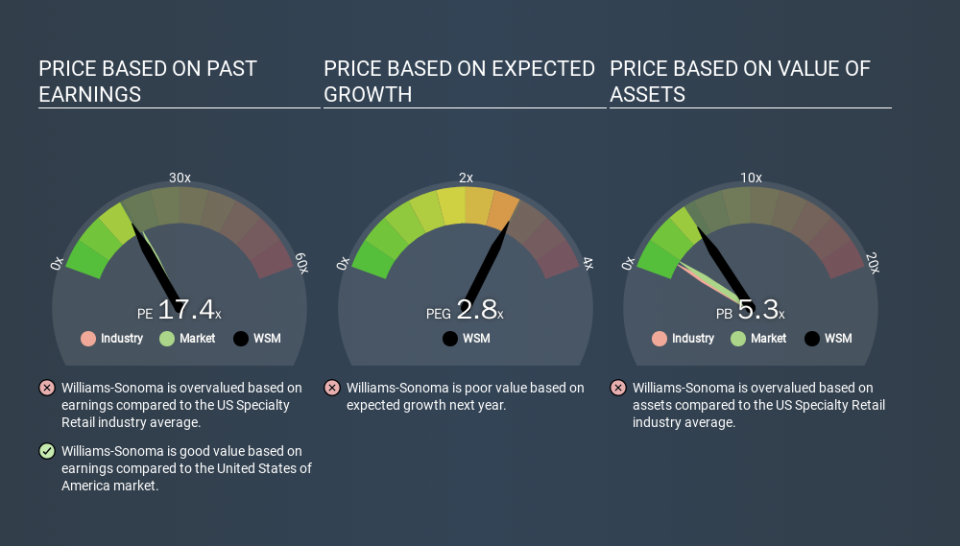
The goal of this article is to teach you how to use price to earnings ratios (P/E ratios). We'll look at Williams-Sonoma, Inc.'s (NYSE:WSM) P/E ratio and reflect on what it tells us about the company's share price. Looking at earnings over the last twelve months, Williams-Sonoma has a P/E ratio of 17.44. In other words, at today's prices, investors are paying $17.44 for every $1 in prior year profit.
Check out our latest analysis for Williams-Sonoma
How Do I Calculate A Price To Earnings Ratio?
The formula for P/E is:
Price to Earnings Ratio = Price per Share ÷ Earnings per Share (EPS)
Or for Williams-Sonoma:
P/E of 17.44 = USD76.59 ÷ USD4.39 (Based on the trailing twelve months to November 2019.)
Is A High Price-to-Earnings Ratio Good?
A higher P/E ratio means that buyers have to pay a higher price for each USD1 the company has earned over the last year. All else being equal, it's better to pay a low price -- but as Warren Buffett said, 'It's far better to buy a wonderful company at a fair price than a fair company at a wonderful price'.
Does Williams-Sonoma Have A Relatively High Or Low P/E For Its Industry?
The P/E ratio essentially measures market expectations of a company. The image below shows that Williams-Sonoma has a P/E ratio that is roughly in line with the specialty retail industry average (16.9).
Williams-Sonoma's P/E tells us that market participants think its prospects are roughly in line with its industry. So if Williams-Sonoma actually outperforms its peers going forward, that should be a positive for the share price. Checking factors such as director buying and selling. could help you form your own view on if that will happen.
How Growth Rates Impact P/E Ratios
Earnings growth rates have a big influence on P/E ratios. That's because companies that grow earnings per share quickly will rapidly increase the 'E' in the equation. That means even if the current P/E is high, it will reduce over time if the share price stays flat. Then, a lower P/E should attract more buyers, pushing the share price up.
Williams-Sonoma increased earnings per share by a whopping 30% last year. And it has bolstered its earnings per share by 7.0% per year over the last five years. So we'd generally expect it to have a relatively high P/E ratio.
Remember: P/E Ratios Don't Consider The Balance Sheet
It's important to note that the P/E ratio considers the market capitalization, not the enterprise value. In other words, it does not consider any debt or cash that the company may have on the balance sheet. Theoretically, a business can improve its earnings (and produce a lower P/E in the future) by investing in growth. That means taking on debt (or spending its cash).
While growth expenditure doesn't always pay off, the point is that it is a good option to have; but one that the P/E ratio ignores.
How Does Williams-Sonoma's Debt Impact Its P/E Ratio?
Williams-Sonoma has net debt worth just 4.1% of its market capitalization. The market might award it a higher P/E ratio if it had net cash, but its unlikely this low level of net borrowing is having a big impact on the P/E multiple.
The Bottom Line On Williams-Sonoma's P/E Ratio
Williams-Sonoma's P/E is 17.4 which is below average (19.0) in the US market. The EPS growth last year was strong, and debt levels are quite reasonable. If it continues to grow, then the current low P/E may prove to be unjustified.
Investors have an opportunity when market expectations about a stock are wrong. If the reality for a company is not as bad as the P/E ratio indicates, then the share price should increase as the market realizes this. So this free report on the analyst consensus forecasts could help you make a master move on this stock.
But note: Williams-Sonoma may not be the best stock to buy. So take a peek at this free list of interesting companies with strong recent earnings growth (and a P/E ratio below 20).
If you spot an error that warrants correction, please contact the editor at editorial-team@simplywallst.com. This article by Simply Wall St is general in nature. It does not constitute a recommendation to buy or sell any stock, and does not take account of your objectives, or your financial situation. Simply Wall St has no position in the stocks mentioned.
We aim to bring you long-term focused research analysis driven by fundamental data. Note that our analysis may not factor in the latest price-sensitive company announcements or qualitative material. Thank you for reading.
