Despite lower earnings than five years ago, VSE (NASDAQ:VSEC) investors are up 151% since then
When you buy shares in a company, it's worth keeping in mind the possibility that it could fail, and you could lose your money. But on the bright side, you can make far more than 100% on a really good stock. For instance, the price of VSE Corporation (NASDAQ:VSEC) stock is up an impressive 140% over the last five years. On the other hand, the stock price has retraced 5.5% in the last week. However, this might be related to the overall market decline of 3.4% in a week.
Although VSE has shed US$89m from its market cap this week, let's take a look at its longer term fundamental trends and see if they've driven returns.
View our latest analysis for VSE
In his essay The Superinvestors of Graham-and-Doddsville Warren Buffett described how share prices do not always rationally reflect the value of a business. One imperfect but simple way to consider how the market perception of a company has shifted is to compare the change in the earnings per share (EPS) with the share price movement.
VSE's earnings per share are down 11% per year, despite strong share price performance over five years.
This means it's unlikely the market is judging the company based on earnings growth. Since the change in EPS doesn't seem to correlate with the change in share price, it's worth taking a look at other metrics.
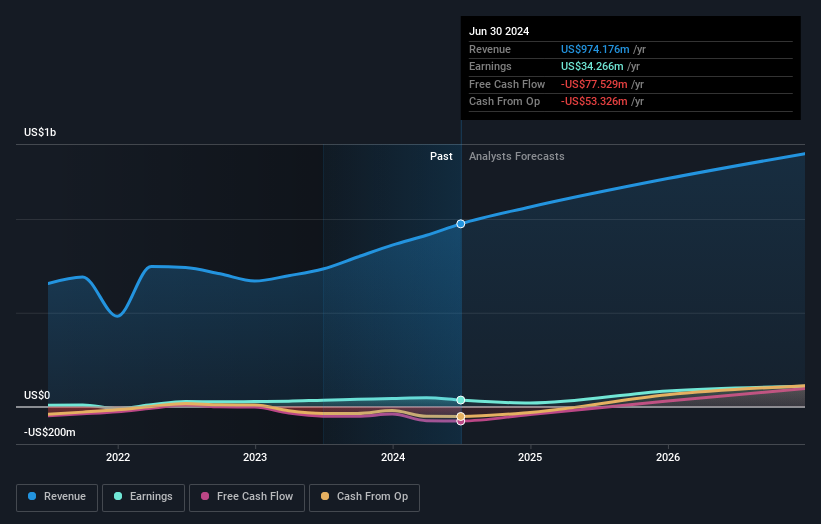
The modest 0.5% dividend yield is unlikely to be propping up the share price. In contrast revenue growth of 4.0% per year is probably viewed as evidence that VSE is growing, a real positive. In that case, the company may be sacrificing current earnings per share to drive growth.
The company's revenue and earnings (over time) are depicted in the image below (click to see the exact numbers).
It is of course excellent to see how VSE has grown profits over the years, but the future is more important for shareholders. You can see how its balance sheet has strengthened (or weakened) over time in this free interactive graphic.
What About Dividends?
When looking at investment returns, it is important to consider the difference between total shareholder return (TSR) and share price return. The TSR incorporates the value of any spin-offs or discounted capital raisings, along with any dividends, based on the assumption that the dividends are reinvested. So for companies that pay a generous dividend, the TSR is often a lot higher than the share price return. We note that for VSE the TSR over the last 5 years was 151%, which is better than the share price return mentioned above. This is largely a result of its dividend payments!
A Different Perspective
It's nice to see that VSE shareholders have received a total shareholder return of 47% over the last year. Of course, that includes the dividend. Since the one-year TSR is better than the five-year TSR (the latter coming in at 20% per year), it would seem that the stock's performance has improved in recent times. Someone with an optimistic perspective could view the recent improvement in TSR as indicating that the business itself is getting better with time. It's always interesting to track share price performance over the longer term. But to understand VSE better, we need to consider many other factors. For instance, we've identified 4 warning signs for VSE (1 can't be ignored) that you should be aware of.
For those who like to find winning investments this free list of undervalued companies with recent insider purchasing, could be just the ticket.
Please note, the market returns quoted in this article reflect the market weighted average returns of stocks that currently trade on American exchanges.
Have feedback on this article? Concerned about the content? Get in touch with us directly. Alternatively, email editorial-team (at) simplywallst.com.
This article by Simply Wall St is general in nature. We provide commentary based on historical data and analyst forecasts only using an unbiased methodology and our articles are not intended to be financial advice. It does not constitute a recommendation to buy or sell any stock, and does not take account of your objectives, or your financial situation. We aim to bring you long-term focused analysis driven by fundamental data. Note that our analysis may not factor in the latest price-sensitive company announcements or qualitative material. Simply Wall St has no position in any stocks mentioned.