
 Yahoo Finance
 Despite shrinking by AU$893m in the past week, Lynas Rare Earths (ASX:LYC) shareholders are still up 824% over 5 years
Lynas Rare Earths Limited (ASX:LYC) shareholders might be concerned after seeing the share price drop 16% in the last quarter. But that doesn't change the fact that the returns over the last half decade have been spectacular. Indeed, the share price is up a whopping 812% in that time. Arguably, the recent fall is to be expected after such a strong rise. But the real question is whether the business fundamentals can improve over the long term. We love happy stories like this one. The company should be really proud of that performance!
Since the long term performance has been good but there's been a recent pullback of 10%, let's check if the fundamentals match the share price.
See our latest analysis for Lynas Rare Earths
To paraphrase Benjamin Graham: Over the short term the market is a voting machine, but over the long term it's a weighing machine. By comparing earnings per share (EPS) and share price changes over time, we can get a feel for how investor attitudes to a company have morphed over time.
During the last half decade, Lynas Rare Earths became profitable. Sometimes, the start of profitability is a major inflection point that can signal fast earnings growth to come, which in turn justifies very strong share price gains. Given that the company made a profit three years ago, but not five years ago, it is worth looking at the share price returns over the last three years, too. Indeed, the Lynas Rare Earths share price has gained 209% in three years. In the same period, EPS is up 114% per year. This EPS growth is higher than the 46% average annual increase in the share price over the same three years. So you might conclude the market is a little more cautious about the stock, these days.
The company's earnings per share (over time) is depicted in the image below (click to see the exact numbers).
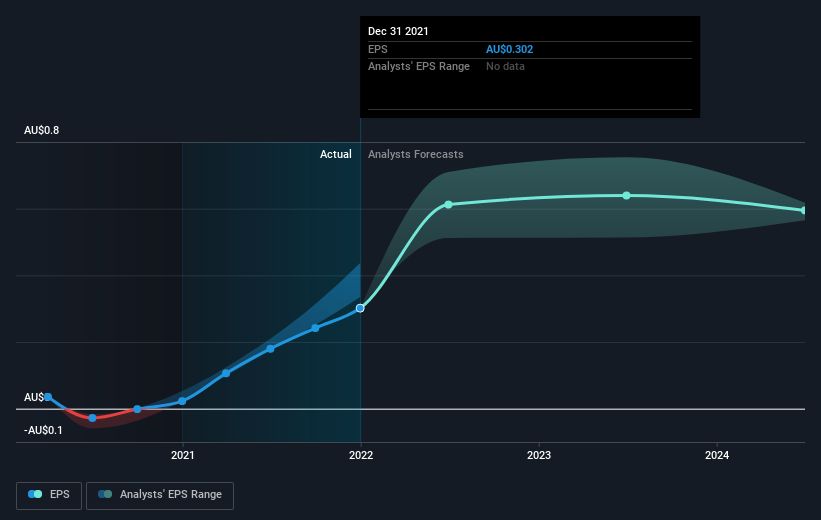
We know that Lynas Rare Earths has improved its bottom line over the last three years, but what does the future have in store? It might be well worthwhile taking a look at our free report on how its financial position has changed over time.
What about the Total Shareholder Return (TSR)?
We'd be remiss not to mention the difference between Lynas Rare Earths' total shareholder return (TSR) and its share price return. The TSR attempts to capture the value of dividends (as if they were reinvested) as well as any spin-offs or discounted capital raisings offered to shareholders. Lynas Rare Earths hasn't been paying dividends, but its TSR of 824% exceeds its share price return of 812%, implying it has either spun-off a business, or raised capital at a discount; thereby providing additional value to shareholders.
A Different Perspective
We're pleased to report that Lynas Rare Earths shareholders have received a total shareholder return of 50% over one year. However, the TSR over five years, coming in at 56% per year, is even more impressive. It's always interesting to track share price performance over the longer term. But to understand Lynas Rare Earths better, we need to consider many other factors. Even so, be aware that Lynas Rare Earths is showing 2 warning signs in our investment analysis , you should know about...
But note: Lynas Rare Earths may not be the best stock to buy. So take a peek at this free list of interesting companies with past earnings growth (and further growth forecast).
Please note, the market returns quoted in this article reflect the market weighted average returns of stocks that currently trade on AU exchanges.
Have feedback on this article? Concerned about the content? Get in touch with us directly. Alternatively, email editorial-team (at) simplywallst.com.
This article by Simply Wall St is general in nature. We provide commentary based on historical data and analyst forecasts only using an unbiased methodology and our articles are not intended to be financial advice. It does not constitute a recommendation to buy or sell any stock, and does not take account of your objectives, or your financial situation. We aim to bring you long-term focused analysis driven by fundamental data. Note that our analysis may not factor in the latest price-sensitive company announcements or qualitative material. Simply Wall St has no position in any stocks mentioned.
