
 Yahoo Finance
 Despite shrinking by US$20m in the past week, Bushveld Minerals (LON:BMN) shareholders are still up 87% over 5 years
Bushveld Minerals Limited (LON:BMN) shareholders might be concerned after seeing the share price drop 11% in the last week. On the bright side the returns have been quite good over the last half decade. It has returned a market beating 87% in that time. While the long term returns are impressive, we do have some sympathy for those who bought more recently, given the 32% drop, in the last year.
In light of the stock dropping 11% in the past week, we want to investigate the longer term story, and see if fundamentals have been the driver of the company's positive five-year return.
See our latest analysis for Bushveld Minerals
Bushveld Minerals isn't currently profitable, so most analysts would look to revenue growth to get an idea of how fast the underlying business is growing. Generally speaking, companies without profits are expected to grow revenue every year, and at a good clip. That's because fast revenue growth can be easily extrapolated to forecast profits, often of considerable size.
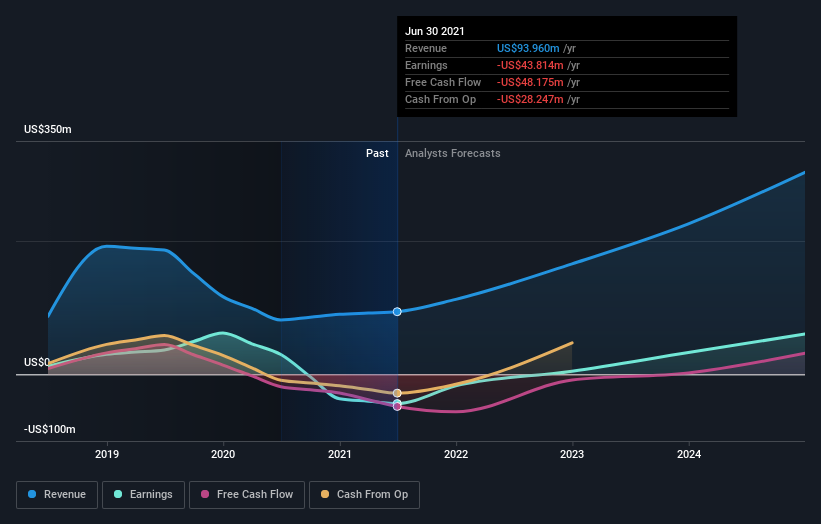
For the last half decade, Bushveld Minerals can boast revenue growth at a rate of 35% per year. Even measured against other revenue-focussed companies, that's a good result. While the compound gain of 13% per year is good, it's not unreasonable given the strong revenue growth. If the strong revenue growth continues, we'd expect the share price to follow, in time. Opportunity lies where the market hasn't fully priced growth in the underlying business.
The graphic below depicts how earnings and revenue have changed over time (unveil the exact values by clicking on the image).
Take a more thorough look at Bushveld Minerals' financial health with this free report on its balance sheet.
A Different Perspective
Investors in Bushveld Minerals had a tough year, with a total loss of 32%, against a market gain of about 3.5%. Even the share prices of good stocks drop sometimes, but we want to see improvements in the fundamental metrics of a business, before getting too interested. On the bright side, long term shareholders have made money, with a gain of 13% per year over half a decade. If the fundamental data continues to indicate long term sustainable growth, the current sell-off could be an opportunity worth considering. It's always interesting to track share price performance over the longer term. But to understand Bushveld Minerals better, we need to consider many other factors. Take risks, for example - Bushveld Minerals has 2 warning signs we think you should be aware of.
If you would prefer to check out another company -- one with potentially superior financials -- then do not miss this free list of companies that have proven they can grow earnings.
Please note, the market returns quoted in this article reflect the market weighted average returns of stocks that currently trade on GB exchanges.
Have feedback on this article? Concerned about the content? Get in touch with us directly. Alternatively, email editorial-team (at) simplywallst.com.
This article by Simply Wall St is general in nature. We provide commentary based on historical data and analyst forecasts only using an unbiased methodology and our articles are not intended to be financial advice. It does not constitute a recommendation to buy or sell any stock, and does not take account of your objectives, or your financial situation. We aim to bring you long-term focused analysis driven by fundamental data. Note that our analysis may not factor in the latest price-sensitive company announcements or qualitative material. Simply Wall St has no position in any stocks mentioned.