
 Yahoo Finance
 DHT Holdings (NYSE:DHT) May Have Issues Allocating Its Capital
What trends should we look for it we want to identify stocks that can multiply in value over the long term? In a perfect world, we'd like to see a company investing more capital into its business and ideally the returns earned from that capital are also increasing. This shows us that it's a compounding machine, able to continually reinvest its earnings back into the business and generate higher returns. However, after investigating DHT Holdings (NYSE:DHT), we don't think it's current trends fit the mold of a multi-bagger.
Understanding Return On Capital Employed (ROCE)
For those that aren't sure what ROCE is, it measures the amount of pre-tax profits a company can generate from the capital employed in its business. To calculate this metric for DHT Holdings, this is the formula:
Return on Capital Employed = Earnings Before Interest and Tax (EBIT) ÷ (Total Assets - Current Liabilities)
0.0031 = US$4.8m ÷ (US$1.6b - US$36m) (Based on the trailing twelve months to September 2021).
So, DHT Holdings has an ROCE of 0.3%. In absolute terms, that's a low return and it also under-performs the Oil and Gas industry average of 9.2%.
See our latest analysis for DHT Holdings
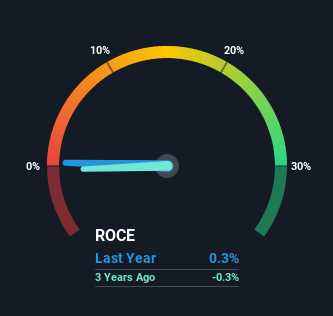
Above you can see how the current ROCE for DHT Holdings compares to its prior returns on capital, but there's only so much you can tell from the past. If you're interested, you can view the analysts predictions in our free report on analyst forecasts for the company.
So How Is DHT Holdings' ROCE Trending?
When we looked at the ROCE trend at DHT Holdings, we didn't gain much confidence. Around five years ago the returns on capital were 11%, but since then they've fallen to 0.3%. And considering revenue has dropped while employing more capital, we'd be cautious. This could mean that the business is losing its competitive advantage or market share, because while more money is being put into ventures, it's actually producing a lower return - "less bang for their buck" per se.
The Key Takeaway
In summary, we're somewhat concerned by DHT Holdings' diminishing returns on increasing amounts of capital. However the stock has delivered a 81% return to shareholders over the last five years, so investors might be expecting the trends to turn around. Regardless, we don't feel too comfortable with the fundamentals so we'd be steering clear of this stock for now.
On a final note, we found 3 warning signs for DHT Holdings (1 shouldn't be ignored) you should be aware of.
If you want to search for solid companies with great earnings, check out this free list of companies with good balance sheets and impressive returns on equity.
Have feedback on this article? Concerned about the content? Get in touch with us directly. Alternatively, email editorial-team (at) simplywallst.com.
This article by Simply Wall St is general in nature. We provide commentary based on historical data and analyst forecasts only using an unbiased methodology and our articles are not intended to be financial advice. It does not constitute a recommendation to buy or sell any stock, and does not take account of your objectives, or your financial situation. We aim to bring you long-term focused analysis driven by fundamental data. Note that our analysis may not factor in the latest price-sensitive company announcements or qualitative material. Simply Wall St has no position in any stocks mentioned.
