
 Yahoo Finance
 Did Business Growth Power Safehold's (NYSE:SAFE) Share Price Gain of 103%?
Unless you borrow money to invest, the potential losses are limited. But if you pick the right business to buy shares in, you can make more than you can lose. For example, the Safehold Inc. (NYSE:SAFE) share price had more than doubled in just one year - up 103%. It's also good to see the share price up 34% over the last quarter. Note that businesses generally develop over the long term, so the returns over the last year might not reflect a long term trend.
View our latest analysis for Safehold
To paraphrase Benjamin Graham: Over the short term the market is a voting machine, but over the long term it's a weighing machine. One flawed but reasonable way to assess how sentiment around a company has changed is to compare the earnings per share (EPS) with the share price.
During the last year Safehold grew its earnings per share (EPS) by 161%. It's fair to say that the share price gain of 103% did not keep pace with the EPS growth. So it seems like the market has cooled on Safehold, despite the growth. Interesting.
The image below shows how EPS has tracked over time (if you click on the image you can see greater detail).
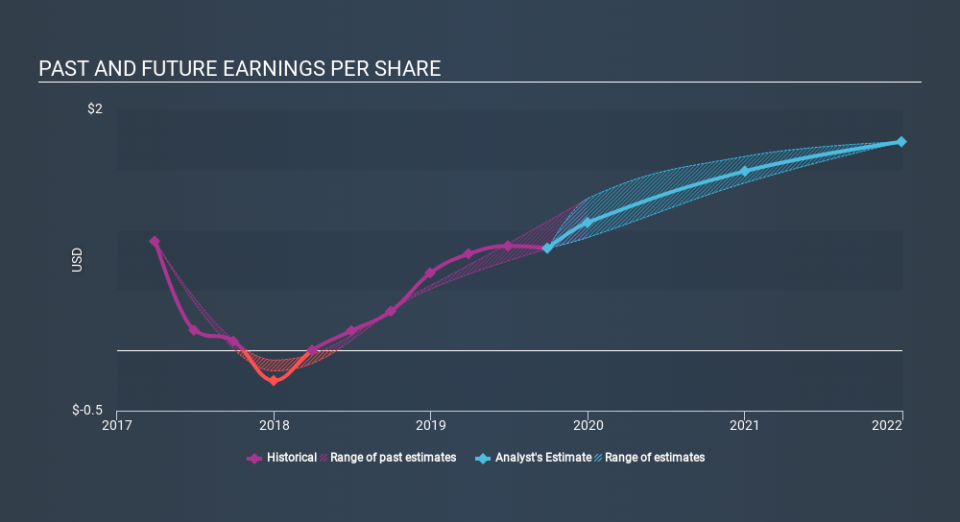
We like that insiders have been buying shares in the last twelve months. Having said that, most people consider earnings and revenue growth trends to be a more meaningful guide to the business. Dive deeper into the earnings by checking this interactive graph of Safehold's earnings, revenue and cash flow.
What About Dividends?
As well as measuring the share price return, investors should also consider the total shareholder return (TSR). Whereas the share price return only reflects the change in the share price, the TSR includes the value of dividends (assuming they were reinvested) and the benefit of any discounted capital raising or spin-off. So for companies that pay a generous dividend, the TSR is often a lot higher than the share price return. We note that for Safehold the TSR over the last year was 109%, which is better than the share price return mentioned above. This is largely a result of its dividend payments!
A Different Perspective
Safehold boasts a total shareholder return of 109% for the last year (that includes the dividends) . And the share price momentum remains respectable, with a gain of 34% in the last three months. This suggests the company is continuing to win over new investors. Investors who like to make money usually check up on insider purchases, such as the price paid, and total amount bought. You can find out about the insider purchases of Safehold by clicking this link.
There are plenty of other companies that have insiders buying up shares. You probably do not want to miss this free list of growing companies that insiders are buying.
Please note, the market returns quoted in this article reflect the market weighted average returns of stocks that currently trade on US exchanges.
If you spot an error that warrants correction, please contact the editor at editorial-team@simplywallst.com. This article by Simply Wall St is general in nature. It does not constitute a recommendation to buy or sell any stock, and does not take account of your objectives, or your financial situation. Simply Wall St has no position in the stocks mentioned.
We aim to bring you long-term focused research analysis driven by fundamental data. Note that our analysis may not factor in the latest price-sensitive company announcements or qualitative material. Thank you for reading.
