
 Yahoo Finance
 Did Camurus's (STO:CAMX) Share Price Deserve to Gain 39%?

The simplest way to invest in stocks is to buy exchange traded funds. But one can do better than that by picking better than average stocks (as part of a diversified portfolio). For example, the Camurus AB (publ) (STO:CAMX) share price is up 39% in the last year, clearly besting the market return of around 19% (not including dividends). So that should have shareholders smiling. On the other hand, longer term shareholders have had a tougher run, with the stock falling 13% in three years.
Check out our latest analysis for Camurus
Camurus wasn't profitable in the last twelve months, it is unlikely we'll see a strong correlation between its share price and its earnings per share (EPS). Arguably revenue is our next best option. When a company doesn't make profits, we'd generally expect to see good revenue growth. That's because it's hard to be confident a company will be sustainable if revenue growth is negligible, and it never makes a profit.
Camurus grew its revenue by 67% last year. That's stonking growth even when compared to other loss-making stocks. While the share price gain of 39% over twelve months is pretty tasty, you might argue it doesn't fully reflect the strong revenue growth. If that's the case, now might be the time to take a close look at Camurus. Human beings have trouble conceptualizing (and valuing) exponential growth. Is that what we're seeing here?
The graphic below depicts how earnings and revenue have changed over time (unveil the exact values by clicking on the image).
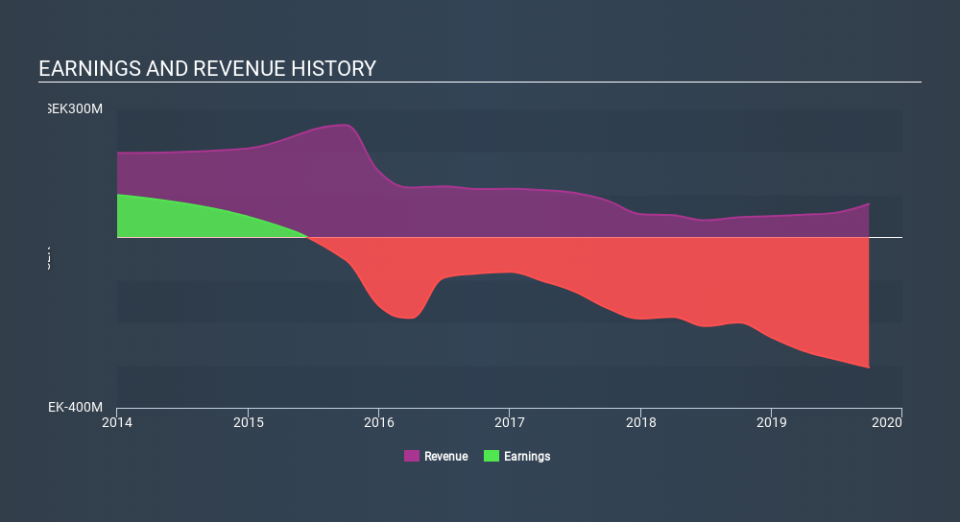
Take a more thorough look at Camurus's financial health with this free report on its balance sheet.
What about the Total Shareholder Return (TSR)?
We've already covered Camurus's share price action, but we should also mention its total shareholder return (TSR). The TSR attempts to capture the value of dividends (as if they were reinvested) as well as any spin-offs or discounted capital raisings offered to shareholders. We note that Camurus's TSR, at 52% is higher than its share price return of 39%. When you consider it hasn't been paying a dividend, this data suggests shareholders have benefitted from a spin-off, or had the opportunity to acquire attractively priced shares in a discounted capital raising.
A Different Perspective
It's nice to see that Camurus shareholders have gained 52% (in total) over the last year. That certainly beats the loss of about 1.6% per year over three years. It could well be that the business has turned around -- or else regained the confidence of investors. It's always interesting to track share price performance over the longer term. But to understand Camurus better, we need to consider many other factors. To that end, you should be aware of the 2 warning signs we've spotted with Camurus .
We will like Camurus better if we see some big insider buys. While we wait, check out this free list of growing companies with considerable, recent, insider buying.
Please note, the market returns quoted in this article reflect the market weighted average returns of stocks that currently trade on SE exchanges.
If you spot an error that warrants correction, please contact the editor at editorial-team@simplywallst.com. This article by Simply Wall St is general in nature. It does not constitute a recommendation to buy or sell any stock, and does not take account of your objectives, or your financial situation. Simply Wall St has no position in the stocks mentioned.
We aim to bring you long-term focused research analysis driven by fundamental data. Note that our analysis may not factor in the latest price-sensitive company announcements or qualitative material. Thank you for reading.
