
 Yahoo Finance
 Did Changing Sentiment Drive Go-Ahead Group's (LON:GOG) Share Price Down A Worrying 69%?

The Go-Ahead Group plc (LON:GOG) shareholders will doubtless be very grateful to see the share price up 60% in the last week. But don't envy holders -- looking back over 5 years the returns have been really bad. In fact, the share price has declined rather badly, down some 69% in that time. So is the recent increase sufficient to restore confidence in the stock? Not yet. Of course, this could be the start of a turnaround.
View our latest analysis for Go-Ahead Group
While markets are a powerful pricing mechanism, share prices reflect investor sentiment, not just underlying business performance. One imperfect but simple way to consider how the market perception of a company has shifted is to compare the change in the earnings per share (EPS) with the share price movement.
During the five years over which the share price declined, Go-Ahead Group's earnings per share (EPS) dropped by 2.2% each year. Readers should note that the share price has fallen faster than the EPS, at a rate of 21% per year, over the period. This implies that the market was previously too optimistic about the stock. The low P/E ratio of 5.39 further reflects this reticence.
The graphic below depicts how EPS has changed over time (unveil the exact values by clicking on the image).
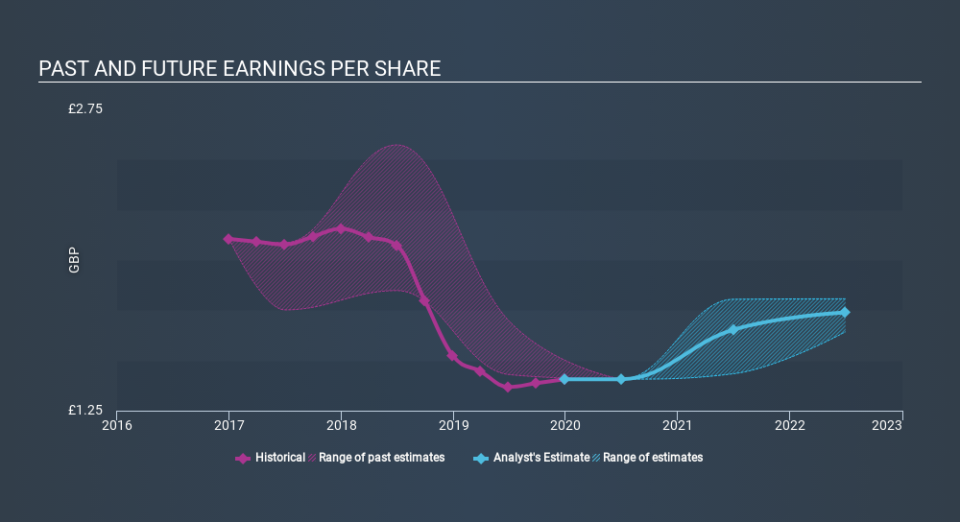
Before buying or selling a stock, we always recommend a close examination of historic growth trends, available here.
What About Dividends?
It is important to consider the total shareholder return, as well as the share price return, for any given stock. The TSR incorporates the value of any spin-offs or discounted capital raisings, along with any dividends, based on the assumption that the dividends are reinvested. It's fair to say that the TSR gives a more complete picture for stocks that pay a dividend. As it happens, Go-Ahead Group's TSR for the last 5 years was -60%, which exceeds the share price return mentioned earlier. The dividends paid by the company have thusly boosted the total shareholder return.
A Different Perspective
We regret to report that Go-Ahead Group shareholders are down 61% for the year (even including dividends) . Unfortunately, that's worse than the broader market decline of 16%. However, it could simply be that the share price has been impacted by broader market jitters. It might be worth keeping an eye on the fundamentals, in case there's a good opportunity. Unfortunately, last year's performance may indicate unresolved challenges, given that it was worse than the annualised loss of 17% over the last half decade. Generally speaking long term share price weakness can be a bad sign, though contrarian investors might want to research the stock in hope of a turnaround. It's always interesting to track share price performance over the longer term. But to understand Go-Ahead Group better, we need to consider many other factors. Take risks, for example - Go-Ahead Group has 3 warning signs we think you should be aware of.
If you like to buy stocks alongside management, then you might just love this free list of companies. (Hint: insiders have been buying them).
Please note, the market returns quoted in this article reflect the market weighted average returns of stocks that currently trade on GB exchanges.
If you spot an error that warrants correction, please contact the editor at editorial-team@simplywallst.com. This article by Simply Wall St is general in nature. It does not constitute a recommendation to buy or sell any stock, and does not take account of your objectives, or your financial situation. Simply Wall St has no position in the stocks mentioned.
We aim to bring you long-term focused research analysis driven by fundamental data. Note that our analysis may not factor in the latest price-sensitive company announcements or qualitative material. Thank you for reading.
