
 Yahoo Finance
 Did Changing Sentiment Drive Bonduelle's (EPA:BON) Share Price Down By 19%?

Passive investing in an index fund is a good way to ensure your own returns roughly match the overall market. Active investors aim to buy stocks that vastly outperform the market - but in the process, they risk under-performance. Investors in Bonduelle SCA (EPA:BON) have tasted that bitter downside in the last year, as the share price dropped 19%. That's disappointing when you consider the market returned 19%. At least the damage isn't so bad if you look at the last three years, since the stock is down 13% in that time. It's up 1.8% in the last seven days.
Check out our latest analysis for Bonduelle
To paraphrase Benjamin Graham: Over the short term the market is a voting machine, but over the long term it's a weighing machine. One imperfect but simple way to consider how the market perception of a company has shifted is to compare the change in the earnings per share (EPS) with the share price movement.
Unfortunately Bonduelle reported an EPS drop of 0.5% for the last year. The share price decline of 19% is actually more than the EPS drop. So it seems the market was too confident about the business, a year ago. The less favorable sentiment is reflected in its current P/E ratio of 9.94.
The graphic below depicts how EPS has changed over time (unveil the exact values by clicking on the image).
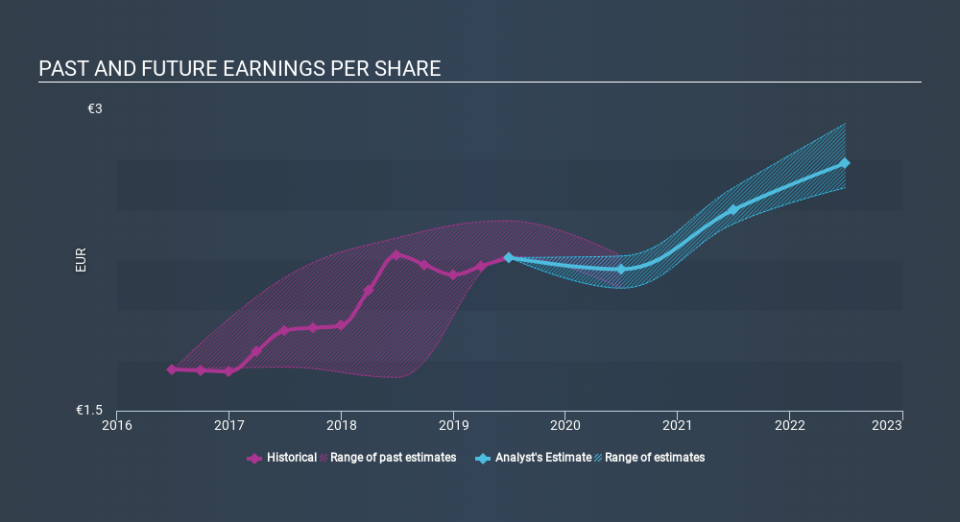
Dive deeper into Bonduelle's key metrics by checking this interactive graph of Bonduelle's earnings, revenue and cash flow.
What about the Total Shareholder Return (TSR)?
We've already covered Bonduelle's share price action, but we should also mention its total shareholder return (TSR). Arguably the TSR is a more complete return calculation because it accounts for the value of dividends (as if they were reinvested), along with the hypothetical value of any discounted capital that have been offered to shareholders. Dividends have been really beneficial for Bonduelle shareholders, and that cash payout explains why its total shareholder loss of 17%, over the last year, isn't as bad as the share price return.
A Different Perspective
While the broader market gained around 19% in the last year, Bonduelle shareholders lost 17% (even including dividends) . However, keep in mind that even the best stocks will sometimes underperform the market over a twelve month period. On the bright side, long term shareholders have made money, with a gain of 0.9% per year over half a decade. If the fundamental data continues to indicate long term sustainable growth, the current sell-off could be an opportunity worth considering. It's always interesting to track share price performance over the longer term. But to understand Bonduelle better, we need to consider many other factors. For example, we've discovered 1 warning sign for Bonduelle that you should be aware of before investing here.
Of course Bonduelle may not be the best stock to buy. So you may wish to see this free collection of growth stocks.
Please note, the market returns quoted in this article reflect the market weighted average returns of stocks that currently trade on FR exchanges.
If you spot an error that warrants correction, please contact the editor at editorial-team@simplywallst.com. This article by Simply Wall St is general in nature. It does not constitute a recommendation to buy or sell any stock, and does not take account of your objectives, or your financial situation. Simply Wall St has no position in the stocks mentioned.
We aim to bring you long-term focused research analysis driven by fundamental data. Note that our analysis may not factor in the latest price-sensitive company announcements or qualitative material. Thank you for reading.
