
 Yahoo Finance
 Did Changing Sentiment Drive G4S's (LON:GFS) Share Price Down By 31%?

For many, the main point of investing is to generate higher returns than the overall market. But the main game is to find enough winners to more than offset the losers At this point some shareholders may be questioning their investment in G4S plc (LON:GFS), since the last five years saw the share price fall 31%. More recently, the share price has dropped a further 10% in a month.
View our latest analysis for G4S
In his essay The Superinvestors of Graham-and-Doddsville Warren Buffett described how share prices do not always rationally reflect the value of a business. One way to examine how market sentiment has changed over time is to look at the interaction between a company's share price and its earnings per share (EPS).
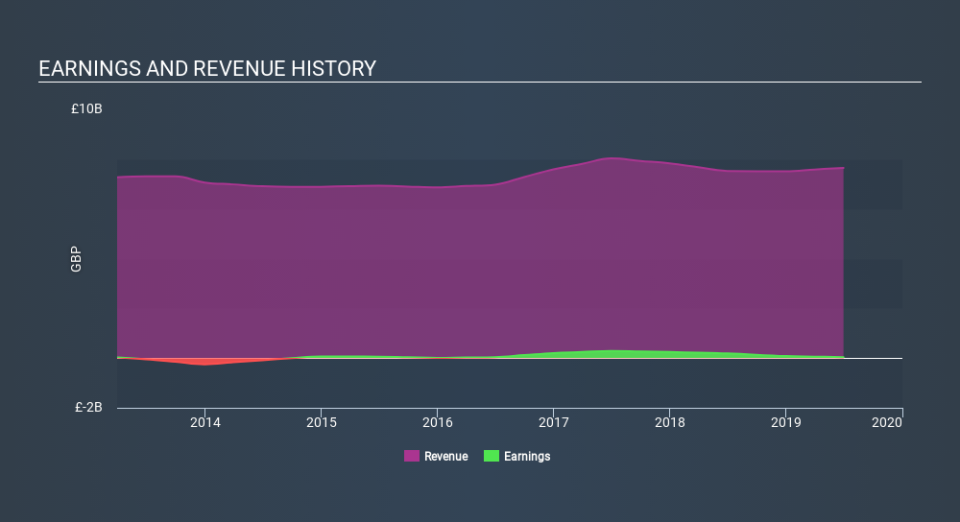
During five years of share price growth, G4S moved from a loss to profitability. That would generally be considered a positive, so we are surprised to see the share price is down. Other metrics might give us a better handle on how its value is changing over time.
We note that the dividend has remained healthy, so that wouldn't really explain the share price drop. While it's not completely obvious why the share price is down, a closer look at the company's history might help explain it.
The graphic below depicts how earnings and revenue have changed over time (unveil the exact values by clicking on the image).
G4S is a well known stock, with plenty of analyst coverage, suggesting some visibility into future growth. So we recommend checking out this free report showing consensus forecasts
What About Dividends?
As well as measuring the share price return, investors should also consider the total shareholder return (TSR). Whereas the share price return only reflects the change in the share price, the TSR includes the value of dividends (assuming they were reinvested) and the benefit of any discounted capital raising or spin-off. So for companies that pay a generous dividend, the TSR is often a lot higher than the share price return. We note that for G4S the TSR over the last 5 years was -16%, which is better than the share price return mentioned above. The dividends paid by the company have thusly boosted the total shareholder return.
A Different Perspective
G4S shareholders are up 1.6% for the year (even including dividends) . Unfortunately this falls short of the market return. But at least that's still a gain! Over five years the TSR has been a reduction of 3.3% per year, over five years. It could well be that the business is stabilizing. While it is well worth considering the different impacts that market conditions can have on the share price, there are other factors that are even more important. For instance, we've identified 4 warning signs for G4S (1 is a bit concerning) that you should be aware of.
For those who like to find winning investments this free list of growing companies with recent insider purchasing, could be just the ticket.
Please note, the market returns quoted in this article reflect the market weighted average returns of stocks that currently trade on GB exchanges.
If you spot an error that warrants correction, please contact the editor at editorial-team@simplywallst.com. This article by Simply Wall St is general in nature. It does not constitute a recommendation to buy or sell any stock, and does not take account of your objectives, or your financial situation. Simply Wall St has no position in the stocks mentioned.
We aim to bring you long-term focused research analysis driven by fundamental data. Note that our analysis may not factor in the latest price-sensitive company announcements or qualitative material. Thank you for reading.
