
 Yahoo Finance
 Did Changing Sentiment Drive Qumu's (NASDAQ:QUMU) Share Price Down A Painful 77%?

We're definitely into long term investing, but some companies are simply bad investments over any time frame. We don't wish catastrophic capital loss on anyone. Imagine if you held Qumu Corporation (NASDAQ:QUMU) for half a decade as the share price tanked 77%. Unfortunately the share price momentum is still quite negative, with prices down 21% in thirty days. This could be related to the recent financial results - you can catch up on the most recent data by reading our company report.
Check out our latest analysis for Qumu
Given that Qumu didn't make a profit in the last twelve months, we'll focus on revenue growth to form a quick view of its business development. Shareholders of unprofitable companies usually expect strong revenue growth. As you can imagine, fast revenue growth, when maintained, often leads to fast profit growth.
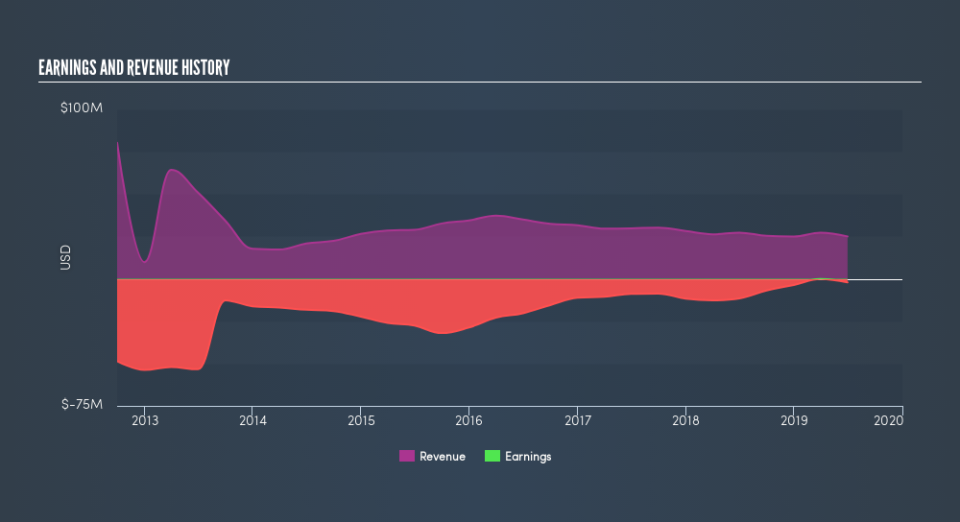
Over half a decade Qumu reduced its trailing twelve month revenue by 0.9% for each year. That's not what investors generally want to see. The share price fall of 26% (per year, over five years) is a stern reminder that money-losing companies are expected to grow revenue. We're generally averse to companies with declining revenues, but we're not alone in that. That is not really what the successful investors we know aim for.
The image below shows how earnings and revenue have tracked over time (if you click on the image you can see greater detail).
This free interactive report on Qumu's balance sheet strength is a great place to start, if you want to investigate the stock further.
A Different Perspective
It's nice to see that Qumu shareholders have received a total shareholder return of 21% over the last year. That certainly beats the loss of about 26% per year over the last half decade. The long term loss makes us cautious, but the short term TSR gain certainly hints at a brighter future. You might want to assess this data-rich visualization of its earnings, revenue and cash flow.
If you like to buy stocks alongside management, then you might just love this free list of companies. (Hint: insiders have been buying them).
Please note, the market returns quoted in this article reflect the market weighted average returns of stocks that currently trade on US exchanges.
We aim to bring you long-term focused research analysis driven by fundamental data. Note that our analysis may not factor in the latest price-sensitive company announcements or qualitative material.
If you spot an error that warrants correction, please contact the editor at editorial-team@simplywallst.com. This article by Simply Wall St is general in nature. It does not constitute a recommendation to buy or sell any stock, and does not take account of your objectives, or your financial situation. Simply Wall St has no position in the stocks mentioned. Thank you for reading.
