
 Yahoo Finance
 Did Changing Sentiment Drive Textainer Group Holdings's (NYSE:TGH) Share Price Down A Painful 73%?

Textainer Group Holdings Limited (NYSE:TGH) shareholders should be happy to see the share price up 10% in the last week. But that is little comfort to those holding over the last half decade, sitting on a big loss. Indeed, the share price is down 73% in the period. So we're not so sure if the recent bounce should be celebrated. We'd err towards caution given the long term under-performance.
Check out our latest analysis for Textainer Group Holdings
To paraphrase Benjamin Graham: Over the short term the market is a voting machine, but over the long term it's a weighing machine. One imperfect but simple way to consider how the market perception of a company has shifted is to compare the change in the earnings per share (EPS) with the share price movement.
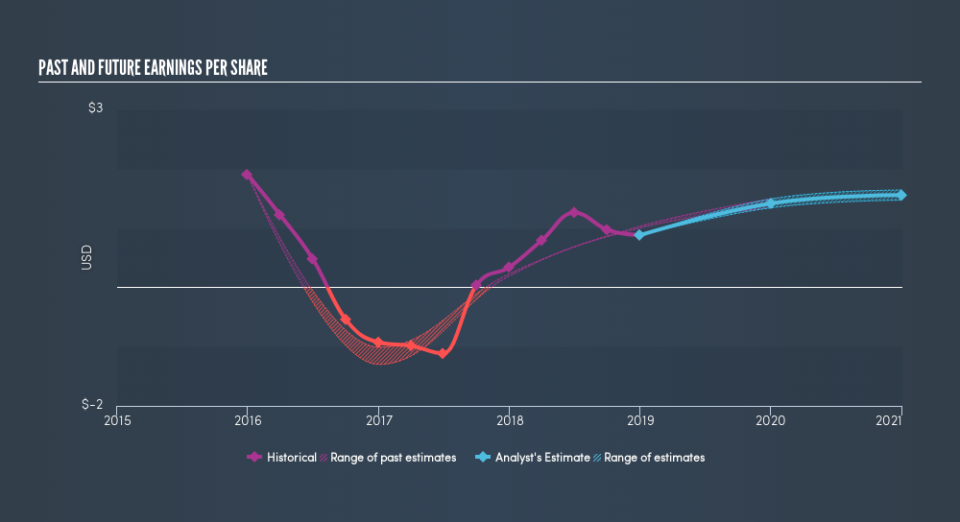
During the five years over which the share price declined, Textainer Group Holdings's earnings per share (EPS) dropped by 23% each year. In this case, the EPS change is really very close to the share price drop of 23% a year. That suggests that the market sentiment around the company hasn't changed much over that time. Rather, the share price change has reflected changes in earnings per share.
You can see how EPS has changed over time in the image below (click on the chart to see the exact values).
We know that Textainer Group Holdings has improved its bottom line lately, but is it going to grow revenue? This free report showing analyst revenue forecasts should help you figure out if the EPS growth can be sustained.
A Dividend Lost
It's important to keep in mind that we've been talking about the share price returns, which don't include dividends, while the total shareholder return does. Many would argue the TSR gives a more complete picture of the value a stock brings to its holders. Textainer Group Holdings's TSR over the last 5 years is -68%; better than its share price return. Although the company had to cut dividends, it has paid cash to shareholders in the past.
A Different Perspective
While the broader market gained around 9.5% in the last year, Textainer Group Holdings shareholders lost 39%. Even the share prices of good stocks drop sometimes, but we want to see improvements in the fundamental metrics of a business, before getting too interested. Regrettably, last year's performance caps off a bad run, with the shareholders facing a total loss of 21% per year over five years. We realise that Buffett has said investors should 'buy when there is blood on the streets', but we caution that investors should first be sure they are buying a high quality businesses. Before deciding if you like the current share price, check how Textainer Group Holdings scores on these 3 valuation metrics.
Of course, you might find a fantastic investment by looking elsewhere. So take a peek at this free list of companies we expect will grow earnings.
Please note, the market returns quoted in this article reflect the market weighted average returns of stocks that currently trade on US exchanges.
We aim to bring you long-term focused research analysis driven by fundamental data. Note that our analysis may not factor in the latest price-sensitive company announcements or qualitative material.
If you spot an error that warrants correction, please contact the editor at editorial-team@simplywallst.com. This article by Simply Wall St is general in nature. It does not constitute a recommendation to buy or sell any stock, and does not take account of your objectives, or your financial situation. Simply Wall St has no position in the stocks mentioned. Thank you for reading.
