
 Yahoo Finance
 Did DISH Network Corporation (NASDAQ:DISH) Use Debt To Deliver Its ROE Of 17%?
While some investors are already well versed in financial metrics (hat tip), this article is for those who would like to learn about Return On Equity (ROE) and why it is important. To keep the lesson grounded in practicality, we'll use ROE to better understand DISH Network Corporation (NASDAQ:DISH).
Return on Equity or ROE is a test of how effectively a company is growing its value and managing investors’ money. Simply put, it is used to assess the profitability of a company in relation to its equity capital.
See our latest analysis for DISH Network
How Is ROE Calculated?
The formula for return on equity is:
Return on Equity = Net Profit (from continuing operations) ÷ Shareholders' Equity
So, based on the above formula, the ROE for DISH Network is:
17% = US$2.7b ÷ US$15b (Based on the trailing twelve months to September 2021).
The 'return' is the profit over the last twelve months. Another way to think of that is that for every $1 worth of equity, the company was able to earn $0.17 in profit.
Does DISH Network Have A Good Return On Equity?
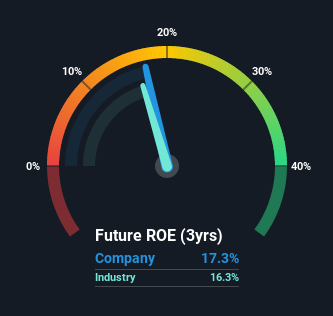
Arguably the easiest way to assess company's ROE is to compare it with the average in its industry. Importantly, this is far from a perfect measure, because companies differ significantly within the same industry classification. You can see in the graphic below that DISH Network has an ROE that is fairly close to the average for the Media industry (16%).
So while the ROE is not exceptional, at least its acceptable. Although the ROE is similar to the industry, we should still perform further checks to see if the company's ROE is being boosted by high debt levels. If true, then it is more an indication of risk than the potential. You can see the 2 risks we have identified for DISH Network by visiting our risks dashboard for free on our platform here.
The Importance Of Debt To Return On Equity
Virtually all companies need money to invest in the business, to grow profits. The cash for investment can come from prior year profits (retained earnings), issuing new shares, or borrowing. In the case of the first and second options, the ROE will reflect this use of cash, for growth. In the latter case, the debt used for growth will improve returns, but won't affect the total equity. Thus the use of debt can improve ROE, albeit along with extra risk in the case of stormy weather, metaphorically speaking.
Combining DISH Network's Debt And Its 17% Return On Equity
It's worth noting the high use of debt by DISH Network, leading to its debt to equity ratio of 1.05. While its ROE is pretty respectable, the amount of debt the company is carrying currently is not ideal. Debt does bring extra risk, so it's only really worthwhile when a company generates some decent returns from it.
Conclusion
Return on equity is useful for comparing the quality of different businesses. Companies that can achieve high returns on equity without too much debt are generally of good quality. All else being equal, a higher ROE is better.
Having said that, while ROE is a useful indicator of business quality, you'll have to look at a whole range of factors to determine the right price to buy a stock. It is important to consider other factors, such as future profit growth -- and how much investment is required going forward. So you might want to check this FREE visualization of analyst forecasts for the company.
Of course, you might find a fantastic investment by looking elsewhere. So take a peek at this free list of interesting companies.
Have feedback on this article? Concerned about the content? Get in touch with us directly. Alternatively, email editorial-team (at) simplywallst.com.
This article by Simply Wall St is general in nature. We provide commentary based on historical data and analyst forecasts only using an unbiased methodology and our articles are not intended to be financial advice. It does not constitute a recommendation to buy or sell any stock, and does not take account of your objectives, or your financial situation. We aim to bring you long-term focused analysis driven by fundamental data. Note that our analysis may not factor in the latest price-sensitive company announcements or qualitative material. Simply Wall St has no position in any stocks mentioned.
