
 Yahoo Finance
 What Did Genmab A/S's (CPH:GMAB) CEO Take Home Last Year?

In 2010 Jan G. van de Winkel was appointed CEO of Genmab A/S (CPH:GMAB). This analysis aims first to contrast CEO compensation with other large companies. Next, we'll consider growth that the business demonstrates. And finally - as a second measure of performance - we will look at the returns shareholders have received over the last few years. This process should give us an idea about how appropriately the CEO is paid.
See our latest analysis for Genmab
How Does Jan G. van de Winkel's Compensation Compare With Similar Sized Companies?
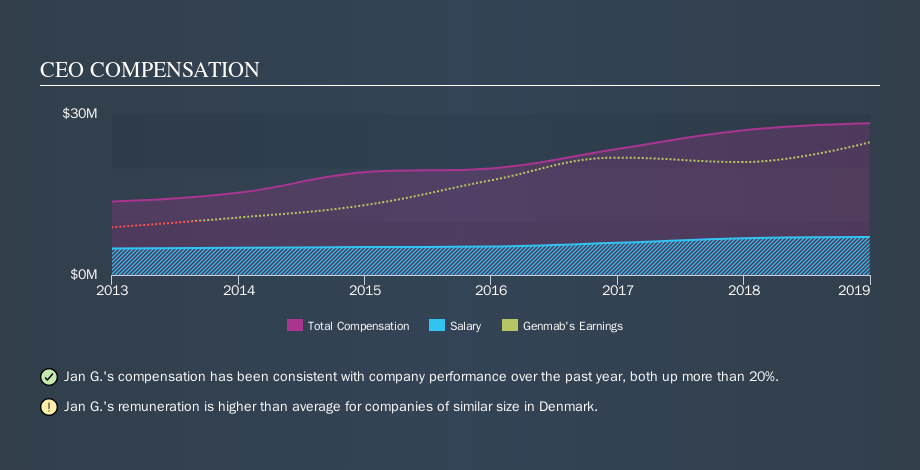
Our data indicates that Genmab A/S is worth ø98b, and total annual CEO compensation was reported as ø28m for the year to December 2018. We think total compensation is more important but we note that the CEO salary is lower, at ø7.1m. We note that more than half of the total compensation is not the salary; and performance requirements may apply to this non-salary portion. We took a group of companies with market capitalizations over ø54b, and calculated the median CEO total compensation to be ø19m. There aren't very many mega-cap companies, so we had to take a wide range to get a meaningful comparison figure.
Thus we can conclude that Jan G. van de Winkel receives more in total compensation than the median of a group of large companies in the same market as Genmab A/S. However, this doesn't necessarily mean the pay is too high. A closer look at the performance of the underlying business will give us a better idea about whether the pay is particularly generous.
You can see, below, how CEO compensation at Genmab has changed over time.
Is Genmab A/S Growing?
Over the last three years Genmab A/S has grown its earnings per share (EPS) by an average of 9.8% per year (using a line of best fit). In the last year, its revenue is up 30%.
I like the look of the strong year-on-year improvement in revenue. Combined with modest EPS growth, we get a good impression of the company. So while I'd stop short of saying growth is absolutely outstanding, there are definitely some clear positives! It could be important to check this free visual depiction of what analysts expect for the future.
Has Genmab A/S Been A Good Investment?
With a total shareholder return of 24% over three years, Genmab A/S shareholders would, in general, be reasonably content. But they probably wouldn't be so happy as to think the CEO should be paid more than is normal, for companies around this size.
In Summary...
We examined the amount Genmab A/S pays its CEO, and compared it to the amount paid by other large companies. We found that it pays well over the median amount paid in the benchmark group.
One might like to have seen stronger growth, and the shareholder returns have failed to inspire, over the last three years. In conclusion we think the company should definitely focus on improving the business before awarding any large pay rises. CEO compensation is one thing, but it is also interesting to check if the CEO is buying or selling Genmab (free visualization of insider trades).
Of course, you might find a fantastic investment by looking elsewhere. So take a peek at this free list of interesting companies.
We aim to bring you long-term focused research analysis driven by fundamental data. Note that our analysis may not factor in the latest price-sensitive company announcements or qualitative material.
If you spot an error that warrants correction, please contact the editor at editorial-team@simplywallst.com. This article by Simply Wall St is general in nature. It does not constitute a recommendation to buy or sell any stock, and does not take account of your objectives, or your financial situation. Simply Wall St has no position in the stocks mentioned. Thank you for reading.
