
 Yahoo Finance
 Did You Manage To Avoid Tullow Oil's (LON:TLW) Devastating 73% Share Price Drop?

Tullow Oil plc (LON:TLW) shareholders should be happy to see the share price up 19% in the last quarter. But that can't change the reality that over the longer term (five years), the returns have been really quite dismal. In fact, the share price has declined rather badly, down some 73% in that time. So is the recent increase sufficient to restore confidence in the stock? Not yet. Of course, this could be the start of a turnaround.
See our latest analysis for Tullow Oil
While the efficient markets hypothesis continues to be taught by some, it has been proven that markets are over-reactive dynamic systems, and investors are not always rational. One flawed but reasonable way to assess how sentiment around a company has changed is to compare the earnings per share (EPS) with the share price.
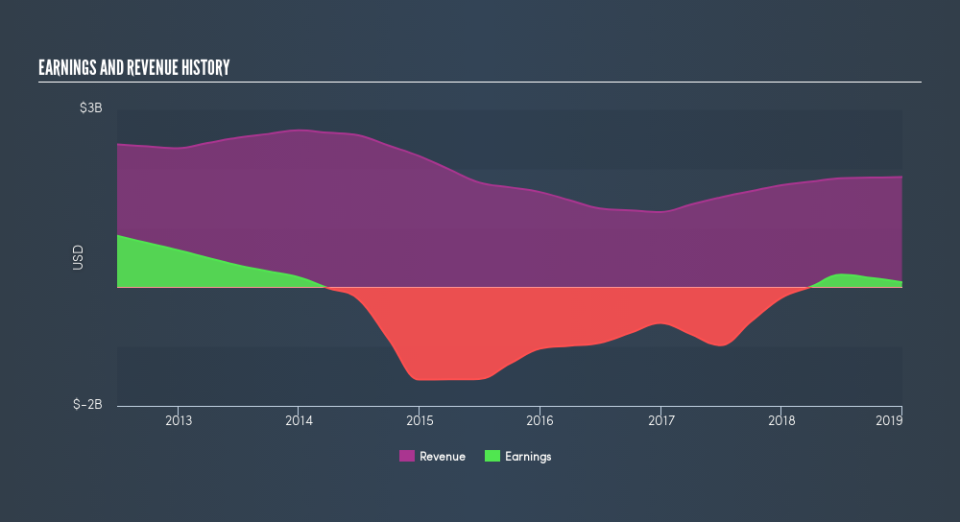
During five years of share price growth, Tullow Oil moved from a loss to profitability. That would generally be considered a positive, so we are surprised to see the share price is down. Other metrics may better explain the share price move.
The modest 1.6% dividend yield is unlikely to be guiding the market view of the stock. Arguably, the revenue drop of 9.2% a year for half a decade suggests that the company can't grow in the long term. That could explain the weak share price.
The graphic below shows how revenue and earnings have changed as management guided the business forward. If you want to see cashflow, you can click on the chart.
Tullow Oil is well known by investors, and plenty of clever analysts have tried to predict the future profit levels. You can see what analysts are predicting for Tullow Oil in this interactive graph of future profit estimates.
What About Dividends?
As well as measuring the share price return, investors should also consider the total shareholder return (TSR). The TSR is a return calculation that accounts for the value of cash dividends (assuming that any dividend received was reinvested) and the calculated value of any discounted capital raisings and spin-offs. So for companies that pay a generous dividend, the TSR is often a lot higher than the share price return. We note that for Tullow Oil the TSR over the last 5 years was -68%, which is better than the share price return mentioned above. The dividends paid by the company have thusly boosted the total shareholder return.
A Different Perspective
Tullow Oil provided a TSR of 2.5% over the last twelve months. But that return falls short of the market. But at least that's still a gain! Over five years the TSR has been a reduction of 20% per year, over five years. It could well be that the business is stabilizing. Before spending more time on Tullow Oil it might be wise to click here to see if insiders have been buying or selling shares.
For those who like to find winning investments this free list of growing companies with recent insider purchasing, could be just the ticket.
Please note, the market returns quoted in this article reflect the market weighted average returns of stocks that currently trade on GB exchanges.
We aim to bring you long-term focused research analysis driven by fundamental data. Note that our analysis may not factor in the latest price-sensitive company announcements or qualitative material.
If you spot an error that warrants correction, please contact the editor at editorial-team@simplywallst.com. This article by Simply Wall St is general in nature. It does not constitute a recommendation to buy or sell any stock, and does not take account of your objectives, or your financial situation. Simply Wall St has no position in the stocks mentioned. Thank you for reading.
