
 Yahoo Finance
 Did You Miss Hong Kong Exchanges and Clearing's (HKG:388) 49% Share Price Gain?

Generally speaking the aim of active stock picking is to find companies that provide returns that are superior to the market average. And the truth is, you can make significant gains if you buy good quality businesses at the right price. For example, long term Hong Kong Exchanges and Clearing Limited (HKG:388) shareholders have enjoyed a 49% share price rise over the last half decade, well in excess of the market return of around 2.5% (not including dividends). On the other hand, the more recent gains haven't been so impressive, with shareholders gaining just 15% , including dividends .
View our latest analysis for Hong Kong Exchanges and Clearing
To paraphrase Benjamin Graham: Over the short term the market is a voting machine, but over the long term it's a weighing machine. One imperfect but simple way to consider how the market perception of a company has shifted is to compare the change in the earnings per share (EPS) with the share price movement.
Over half a decade, Hong Kong Exchanges and Clearing managed to grow its earnings per share at 13% a year. This EPS growth is higher than the 8.3% average annual increase in the share price. So it seems the market isn't so enthusiastic about the stock these days.
You can see below how EPS has changed over time (discover the exact values by clicking on the image).
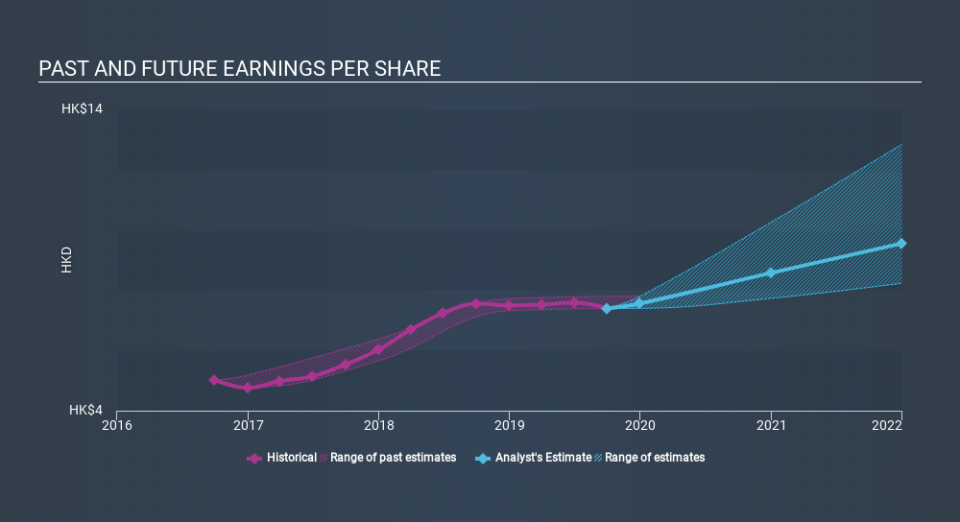
Dive deeper into Hong Kong Exchanges and Clearing's key metrics by checking this interactive graph of Hong Kong Exchanges and Clearing's earnings, revenue and cash flow.
What About Dividends?
It is important to consider the total shareholder return, as well as the share price return, for any given stock. Whereas the share price return only reflects the change in the share price, the TSR includes the value of dividends (assuming they were reinvested) and the benefit of any discounted capital raising or spin-off. So for companies that pay a generous dividend, the TSR is often a lot higher than the share price return. As it happens, Hong Kong Exchanges and Clearing's TSR for the last 5 years was 69%, which exceeds the share price return mentioned earlier. And there's no prize for guessing that the dividend payments largely explain the divergence!
A Different Perspective
It's good to see that Hong Kong Exchanges and Clearing has rewarded shareholders with a total shareholder return of 15% in the last twelve months. And that does include the dividend. That's better than the annualised return of 11% over half a decade, implying that the company is doing better recently. In the best case scenario, this may hint at some real business momentum, implying that now could be a great time to delve deeper. Before forming an opinion on Hong Kong Exchanges and Clearing you might want to consider these 3 valuation metrics.
If you like to buy stocks alongside management, then you might just love this free list of companies. (Hint: insiders have been buying them).
Please note, the market returns quoted in this article reflect the market weighted average returns of stocks that currently trade on HK exchanges.
If you spot an error that warrants correction, please contact the editor at editorial-team@simplywallst.com. This article by Simply Wall St is general in nature. It does not constitute a recommendation to buy or sell any stock, and does not take account of your objectives, or your financial situation. Simply Wall St has no position in the stocks mentioned.
We aim to bring you long-term focused research analysis driven by fundamental data. Note that our analysis may not factor in the latest price-sensitive company announcements or qualitative material. Thank you for reading.
