
 Yahoo Finance
 Did You Miss NEXT's (LON:NXT) 40% Share Price Gain?

By buying an index fund, investors can approximate the average market return. But if you choose individual stocks with prowess, you can make superior returns. For example, NEXT plc (LON:NXT) shareholders have seen the share price rise 40% over three years, well in excess of the market decline (19%, not including dividends).
See our latest analysis for NEXT
While the efficient markets hypothesis continues to be taught by some, it has been proven that markets are over-reactive dynamic systems, and investors are not always rational. By comparing earnings per share (EPS) and share price changes over time, we can get a feel for how investor attitudes to a company have morphed over time.
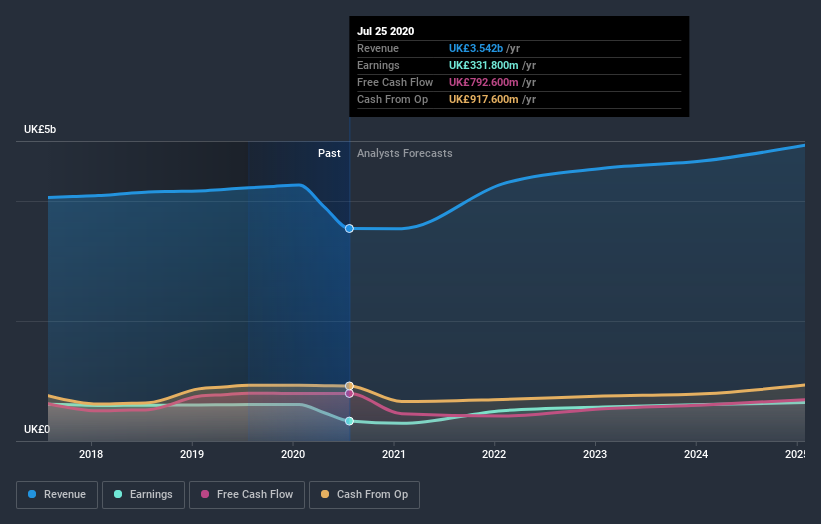
During the three years of share price growth, NEXT actually saw its earnings per share (EPS) drop 16% per year.
Thus, it seems unlikely that the market is focussed on EPS growth at the moment. Since the change in EPS doesn't seem to correlate with the change in share price, it's worth taking a look at other metrics.
The revenue drop of 1.5% is as underwhelming as some politicians. The only thing that's clear is there is low correlation between NEXT's share price and its historic fundamental data. Further research may be required!
The graphic below depicts how earnings and revenue have changed over time (unveil the exact values by clicking on the image).
We like that insiders have been buying shares in the last twelve months. Having said that, most people consider earnings and revenue growth trends to be a more meaningful guide to the business. If you are thinking of buying or selling NEXT stock, you should check out this free report showing analyst profit forecasts.
What about the Total Shareholder Return (TSR)?
We've already covered NEXT's share price action, but we should also mention its total shareholder return (TSR). The TSR is a return calculation that accounts for the value of cash dividends (assuming that any dividend received was reinvested) and the calculated value of any discounted capital raisings and spin-offs. Dividends have been really beneficial for NEXT shareholders, and that cash payout contributed to why its TSR of 52%, over the last 3 years, is better than the share price return.
A Different Perspective
Although it hurts that NEXT returned a loss of 7.4% in the last twelve months, the broader market was actually worse, returning a loss of 13%. Given the total loss of 1.0% per year over five years, it seems returns have deteriorated in the last twelve months. Whilst Baron Rothschild does tell the investor "buy when there's blood in the streets, even if the blood is your own", buyers would need to examine the data carefully to be comfortable that the business itself is sound. It's always interesting to track share price performance over the longer term. But to understand NEXT better, we need to consider many other factors. For example, we've discovered 3 warning signs for NEXT that you should be aware of before investing here.
There are plenty of other companies that have insiders buying up shares. You probably do not want to miss this free list of growing companies that insiders are buying.
Please note, the market returns quoted in this article reflect the market weighted average returns of stocks that currently trade on GB exchanges.
This article by Simply Wall St is general in nature. It does not constitute a recommendation to buy or sell any stock, and does not take account of your objectives, or your financial situation. We aim to bring you long-term focused analysis driven by fundamental data. Note that our analysis may not factor in the latest price-sensitive company announcements or qualitative material. Simply Wall St has no position in any stocks mentioned.
Have feedback on this article? Concerned about the content? Get in touch with us directly. Alternatively, email editorial-team@simplywallst.com.