
 Yahoo Finance
 Did You Participate In Any Of Aptitude Software Group's (LON:APTD) Fantastic 210% Return ?
While Aptitude Software Group plc (LON:APTD) shareholders are probably generally happy, the stock hasn't had particularly good run recently, with the share price falling 16% in the last quarter. But that scarcely detracts from the really solid long term returns generated by the company over five years. Indeed, the share price is up an impressive 153% in that time. We think it's more important to dwell on the long term returns than the short term returns. Ultimately business performance will determine whether the stock price continues the positive long term trend.
See our latest analysis for Aptitude Software Group
To quote Buffett, 'Ships will sail around the world but the Flat Earth Society will flourish. There will continue to be wide discrepancies between price and value in the marketplace...' By comparing earnings per share (EPS) and share price changes over time, we can get a feel for how investor attitudes to a company have morphed over time.
Over half a decade, Aptitude Software Group managed to grow its earnings per share at 13% a year. This EPS growth is slower than the share price growth of 20% per year, over the same period. So it's fair to assume the market has a higher opinion of the business than it did five years ago. That's not necessarily surprising considering the five-year track record of earnings growth. This optimism is visible in its fairly high P/E ratio of 45.64.
You can see how EPS has changed over time in the image below (click on the chart to see the exact values).
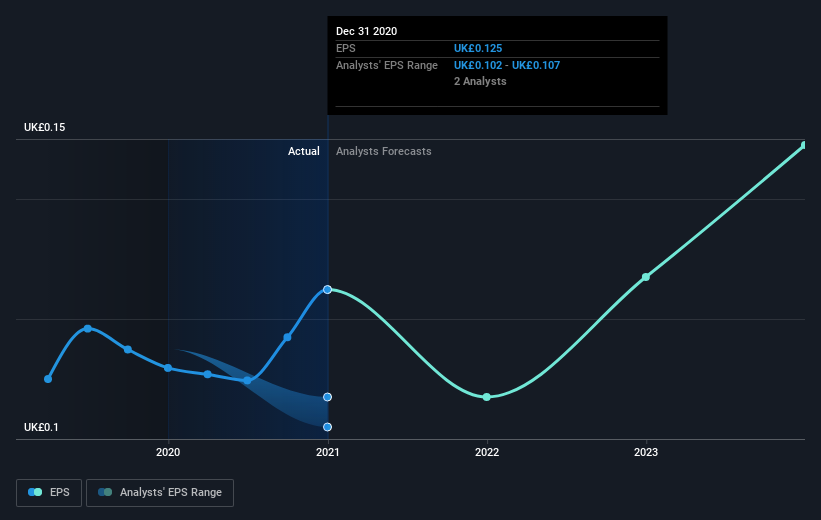
We know that Aptitude Software Group has improved its bottom line lately, but is it going to grow revenue? Check if analysts think Aptitude Software Group will grow revenue in the future.
What About Dividends?
As well as measuring the share price return, investors should also consider the total shareholder return (TSR). Whereas the share price return only reflects the change in the share price, the TSR includes the value of dividends (assuming they were reinvested) and the benefit of any discounted capital raising or spin-off. Arguably, the TSR gives a more comprehensive picture of the return generated by a stock. In the case of Aptitude Software Group, it has a TSR of 210% for the last 5 years. That exceeds its share price return that we previously mentioned. This is largely a result of its dividend payments!
A Different Perspective
We're pleased to report that Aptitude Software Group shareholders have received a total shareholder return of 40% over one year. Of course, that includes the dividend. That gain is better than the annual TSR over five years, which is 25%. Therefore it seems like sentiment around the company has been positive lately. In the best case scenario, this may hint at some real business momentum, implying that now could be a great time to delve deeper. Before forming an opinion on Aptitude Software Group you might want to consider these 3 valuation metrics.
We will like Aptitude Software Group better if we see some big insider buys. While we wait, check out this free list of growing companies with considerable, recent, insider buying.
Please note, the market returns quoted in this article reflect the market weighted average returns of stocks that currently trade on GB exchanges.
This article by Simply Wall St is general in nature. It does not constitute a recommendation to buy or sell any stock, and does not take account of your objectives, or your financial situation. We aim to bring you long-term focused analysis driven by fundamental data. Note that our analysis may not factor in the latest price-sensitive company announcements or qualitative material. Simply Wall St has no position in any stocks mentioned.
Have feedback on this article? Concerned about the content? Get in touch with us directly. Alternatively, email editorial-team (at) simplywallst.com.
