
 Yahoo Finance
 Did You Participate In Any Of Eversource Energy's (NYSE:ES) Fantastic 104% Return ?

Passive investing in index funds can generate returns that roughly match the overall market. But the truth is, you can make significant gains if you buy good quality businesses at the right price. For example, the Eversource Energy (NYSE:ES) share price is up 75% in the last five years, slightly above the market return. It's also good to see that the stock is up 6.1% in a year.
See our latest analysis for Eversource Energy
To paraphrase Benjamin Graham: Over the short term the market is a voting machine, but over the long term it's a weighing machine. One way to examine how market sentiment has changed over time is to look at the interaction between a company's share price and its earnings per share (EPS).
Over half a decade, Eversource Energy managed to grow its earnings per share at 3.9% a year. This EPS growth is slower than the share price growth of 12% per year, over the same period. So it's fair to assume the market has a higher opinion of the business than it did five years ago. And that's hardly shocking given the track record of growth.
You can see below how EPS has changed over time (discover the exact values by clicking on the image).
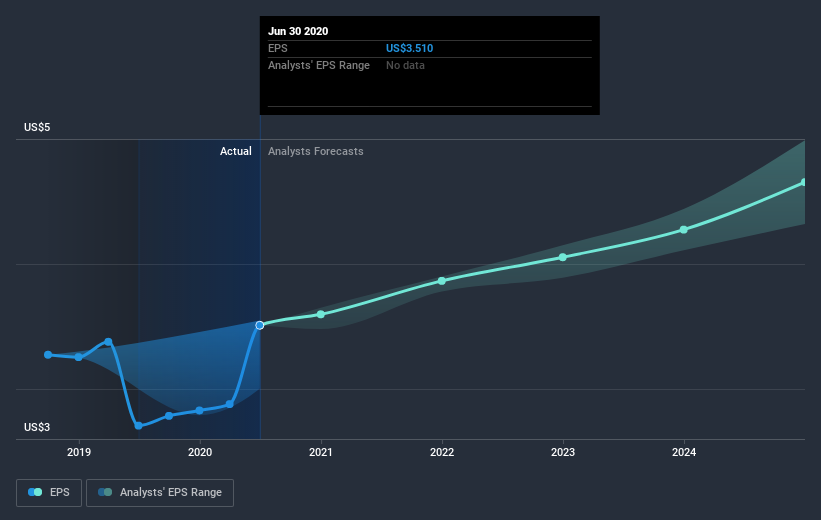
We consider it positive that insiders have made significant purchases in the last year. Even so, future earnings will be far more important to whether current shareholders make money. Dive deeper into the earnings by checking this interactive graph of Eversource Energy's earnings, revenue and cash flow.
What About Dividends?
As well as measuring the share price return, investors should also consider the total shareholder return (TSR). The TSR incorporates the value of any spin-offs or discounted capital raisings, along with any dividends, based on the assumption that the dividends are reinvested. Arguably, the TSR gives a more comprehensive picture of the return generated by a stock. As it happens, Eversource Energy's TSR for the last 5 years was 104%, which exceeds the share price return mentioned earlier. And there's no prize for guessing that the dividend payments largely explain the divergence!
A Different Perspective
Eversource Energy shareholders gained a total return of 8.9% during the year. Unfortunately this falls short of the market return. If we look back over five years, the returns are even better, coming in at 15% per year for five years. It may well be that this is a business worth popping on the watching, given the continuing positive reception, over time, from the market. It's always interesting to track share price performance over the longer term. But to understand Eversource Energy better, we need to consider many other factors. Take risks, for example - Eversource Energy has 3 warning signs (and 1 which doesn't sit too well with us) we think you should know about.
Eversource Energy is not the only stock insiders are buying. So take a peek at this free list of growing companies with insider buying.
Please note, the market returns quoted in this article reflect the market weighted average returns of stocks that currently trade on US exchanges.
This article by Simply Wall St is general in nature. It does not constitute a recommendation to buy or sell any stock, and does not take account of your objectives, or your financial situation. We aim to bring you long-term focused analysis driven by fundamental data. Note that our analysis may not factor in the latest price-sensitive company announcements or qualitative material. Simply Wall St has no position in any stocks mentioned.
Have feedback on this article? Concerned about the content? Get in touch with us directly. Alternatively, email editorial-team@simplywallst.com.
