
 Yahoo Finance
 Did You Participate In Any Of Scotts Miracle-Gro's (NYSE:SMG) Fantastic 229% Return ?
The Scotts Miracle-Gro Company (NYSE:SMG) shareholders might be concerned after seeing the share price drop 18% in the last quarter. But that doesn't change the fact that shareholders have received really good returns over the last five years. Indeed, the share price is up an impressive 187% in that time. So while it's never fun to see a share price fall, it's important to look at a longer time horizon. Only time will tell if there is still too much optimism currently reflected in the share price.
View our latest analysis for Scotts Miracle-Gro
While markets are a powerful pricing mechanism, share prices reflect investor sentiment, not just underlying business performance. One way to examine how market sentiment has changed over time is to look at the interaction between a company's share price and its earnings per share (EPS).
During five years of share price growth, Scotts Miracle-Gro achieved compound earnings per share (EPS) growth of 22% per year. So the EPS growth rate is rather close to the annualized share price gain of 23% per year. That suggests that the market sentiment around the company hasn't changed much over that time. Indeed, it would appear the share price is reacting to the EPS.
The image below shows how EPS has tracked over time (if you click on the image you can see greater detail).
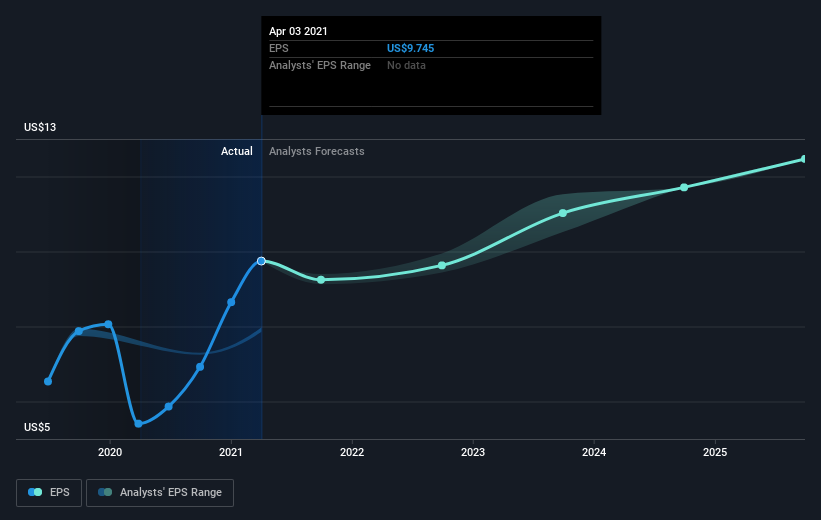
It is of course excellent to see how Scotts Miracle-Gro has grown profits over the years, but the future is more important for shareholders. Take a more thorough look at Scotts Miracle-Gro's financial health with this free report on its balance sheet.
What About Dividends?
When looking at investment returns, it is important to consider the difference between total shareholder return (TSR) and share price return. Whereas the share price return only reflects the change in the share price, the TSR includes the value of dividends (assuming they were reinvested) and the benefit of any discounted capital raising or spin-off. So for companies that pay a generous dividend, the TSR is often a lot higher than the share price return. We note that for Scotts Miracle-Gro the TSR over the last 5 years was 229%, which is better than the share price return mentioned above. This is largely a result of its dividend payments!
A Different Perspective
We're pleased to report that Scotts Miracle-Gro shareholders have received a total shareholder return of 55% over one year. And that does include the dividend. That's better than the annualised return of 27% over half a decade, implying that the company is doing better recently. In the best case scenario, this may hint at some real business momentum, implying that now could be a great time to delve deeper. I find it very interesting to look at share price over the long term as a proxy for business performance. But to truly gain insight, we need to consider other information, too. For example, we've discovered 2 warning signs for Scotts Miracle-Gro (1 is significant!) that you should be aware of before investing here.
Of course Scotts Miracle-Gro may not be the best stock to buy. So you may wish to see this free collection of growth stocks.
Please note, the market returns quoted in this article reflect the market weighted average returns of stocks that currently trade on US exchanges.
This article by Simply Wall St is general in nature. It does not constitute a recommendation to buy or sell any stock, and does not take account of your objectives, or your financial situation. We aim to bring you long-term focused analysis driven by fundamental data. Note that our analysis may not factor in the latest price-sensitive company announcements or qualitative material. Simply Wall St has no position in any stocks mentioned.
Have feedback on this article? Concerned about the content? Get in touch with us directly. Alternatively, email editorial-team (at) simplywallst.com.
