
 Yahoo Finance
 Did Rurelec PLC’s (LON:RUR) Recent Earnings Growth Beat The Trend?

Today I will examine Rurelec PLC’s (AIM:RUR) latest earnings update (31 December 2017) and compare these figures against its performance over the past couple of years, in addition to how the rest of RUR’s industry performed. As a long-term investor, I find it useful to analyze the company’s trend over time in order to estimate whether or not the company is able to meet its goals, and eventually grow sustainably over time. See our latest analysis for Rurelec
Did RUR’s recent earnings growth beat the long-term trend and the industry?
I like to use the ‘latest twelve-month’ data, which either annualizes the most recent 6-month earnings update, or in some cases, the most recent annual report is already the latest available financial data. This blend allows me to assess many different companies on a more comparable basis, using new information. For Rurelec, its most recent trailing-twelve-month earnings is -UK£5.82M, which compared to last year’s level, has become less negative. Given that these values may be somewhat nearsighted, I have created an annualized five-year value for Rurelec’s net income, which stands at -UK£10.94M. This shows that, while net income is negative, it has become less negative over the years.
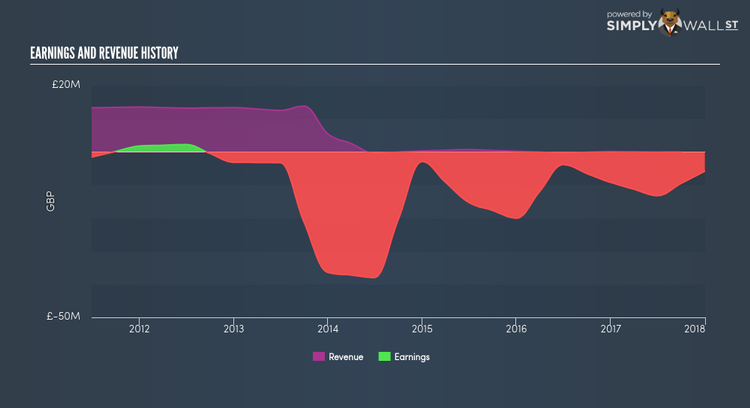
We can further evaluate Rurelec’s loss by looking at what the industry has been experiencing over the past few years. Each year, for the past half a decade Rurelec has seen an annual decline in revenue of -53.26%, on average. This adverse movement is a driver of the company’s inability to reach breakeven. Has the entire industry experienced this headwind? Inspecting growth from a sector-level, the UK renewable energy industry has been enduring severe headwinds over the past year, leading to an average earnings drop of -41.16%. This is a significant change, given that the industry has constantly been delivering a a robust growth of 24.66% in the previous five years. This suggests that although Rurelec is currently running a loss, whatever near-term headwind the industry is experiencing, Rurelec is relatively better-cushioned than its peers.
What does this mean?
While past data is useful, it doesn’t tell the whole story. Companies that incur net loss is always hard to envisage what will happen in the future and when. The most valuable step is to assess company-specific issues Rurelec may be facing and whether management guidance has dependably been met in the past. I suggest you continue to research Rurelec to get a more holistic view of the stock by looking at:
Financial Health: Is RUR’s operations financially sustainable? Balance sheets can be hard to analyze, which is why we’ve done it for you. Check out our financial health checks here.
Valuation: What is RUR worth today? Is the stock undervalued, even when its growth outlook is factored into its intrinsic value? The intrinsic value infographic in our free research report helps visualize whether RUR is currently mispriced by the market.
Other High-Performing Stocks: Are there other stocks that provide better prospects with proven track records? Explore our free list of these great stocks here.
NB: Figures in this article are calculated using data from the trailing twelve months from 31 December 2017. This may not be consistent with full year annual report figures.
To help readers see pass the short term volatility of the financial market, we aim to bring you a long-term focused research analysis purely driven by fundamental data. Note that our analysis does not factor in the latest price sensitive company announcements.
The author is an independent contributor and at the time of publication had no position in the stocks mentioned.
