
 Yahoo Finance
 How Did Société Générale Société anonyme’s (EPA:GLE) 5.58% ROE Fare Against The Industry?

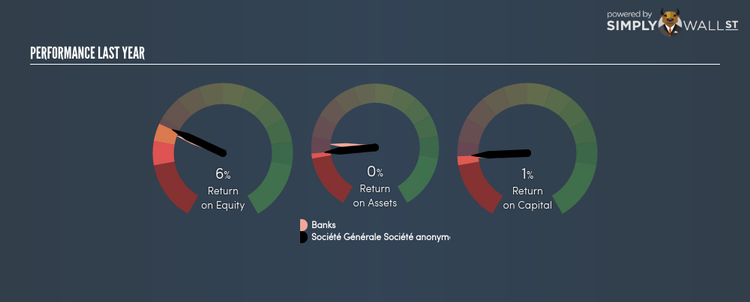
Société Générale Société anonyme (ENXTPA:GLE) delivered an ROE of 5.58% over the past 12 months, which is an impressive feat relative to its industry average of 4.88% during the same period. Superficially, this looks great since we know that GLE has generated big profits with little equity capital; however, ROE doesn’t tell us how much GLE has borrowed in debt. Today, we’ll take a closer look at some factors like financial leverage to see how sustainable GLE’s ROE is. View our latest analysis for Société Générale Société anonyme
What you must know about ROE
Firstly, Return on Equity, or ROE, is simply the percentage of last years’ earning against the book value of shareholders’ equity. It essentially shows how much the company can generate in earnings given the amount of equity it has raised. While a higher ROE is preferred in most cases, there are several other factors we should consider before drawing any conclusions.
Return on Equity = Net Profit ÷ Shareholders Equity
ROE is measured against cost of equity in order to determine the efficiency of Société Générale Société anonyme’s equity capital deployed. Its cost of equity is 13.87%. This means Société Générale Société anonyme’s returns actually do not cover its own cost of equity, with a discrepancy of -8.29%. This isn’t sustainable as it implies, very simply, that the company pays more for its capital than what it generates in return. ROE can be split up into three useful ratios: net profit margin, asset turnover, and financial leverage. This is called the Dupont Formula:
Dupont Formula
ROE = profit margin × asset turnover × financial leverage
ROE = (annual net profit ÷ sales) × (sales ÷ assets) × (assets ÷ shareholders’ equity)
ROE = annual net profit ÷ shareholders’ equity
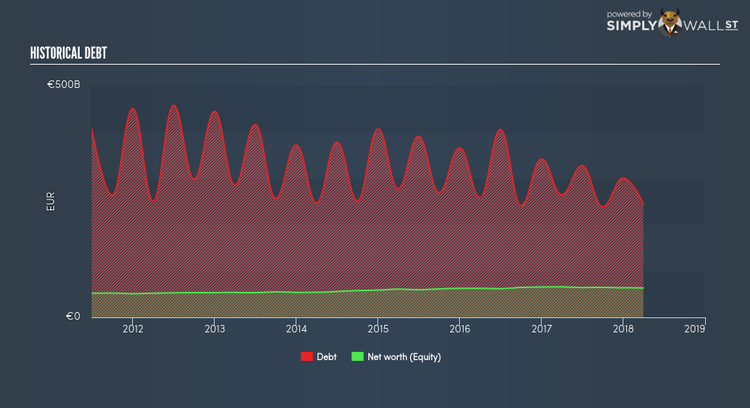
Essentially, profit margin shows how much money the company makes after paying for all its expenses. Asset turnover reveals how much revenue can be generated from Société Générale Société anonyme’s asset base. And finally, financial leverage is simply how much of assets are funded by equity, which exhibits how sustainable the company’s capital structure is. Since ROE can be artificially increased through excessive borrowing, we should check Société Générale Société anonyme’s historic debt-to-equity ratio. Currently the debt-to-equity ratio stands at more than 2.5 times, which means its above-average ROE is driven by significant debt levels.
Next Steps:
While ROE is a relatively simple calculation, it can be broken down into different ratios, each telling a different story about the strengths and weaknesses of a company. Société Générale Société anonyme’s above-industry ROE is noteworthy, but it was not high enough to cover its own cost of equity. With debt capital in excess of equity, ROE may be inflated by the use of debt funding, raising questions over the sustainability of the company’s returns. Although ROE can be a useful metric, it is only a small part of diligent research.
For Société Générale Société anonyme, I’ve compiled three important factors you should look at:
Financial Health: Does it have a healthy balance sheet? Take a look at our free balance sheet analysis with six simple checks on key factors like leverage and risk.
Valuation: What is Société Générale Société anonyme worth today? Is the stock undervalued, even when its growth outlook is factored into its intrinsic value? The intrinsic value infographic in our free research report helps visualize whether Société Générale Société anonyme is currently mispriced by the market.
Other High-Growth Alternatives : Are there other high-growth stocks you could be holding instead of Société Générale Société anonyme? Explore our interactive list of stocks with large growth potential to get an idea of what else is out there you may be missing!
To help readers see pass the short term volatility of the financial market, we aim to bring you a long-term focused research analysis purely driven by fundamental data. Note that our analysis does not factor in the latest price sensitive company announcements.
The author is an independent contributor and at the time of publication had no position in the stocks mentioned.
