
 Yahoo Finance
 Did Transurban Group's (ASX:TCL) Share Price Deserve to Gain 79%?

Stock pickers are generally looking for stocks that will outperform the broader market. And the truth is, you can make significant gains if you buy good quality businesses at the right price. To wit, the Transurban Group share price has climbed 79% in five years, easily topping the market return of 16% (ignoring dividends). On the other hand, the more recent gains haven't been so impressive, with shareholders gaining just 37% , including dividends .
View our latest analysis for Transurban Group
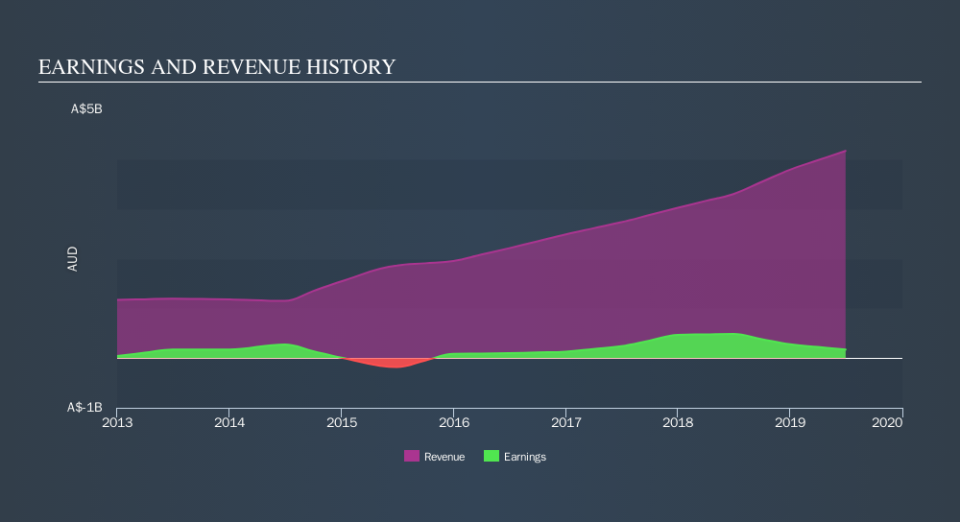
Given that Transurban Group only made minimal earnings in the last twelve months, we'll focus on revenue to gauge its business development. As a general rule, we think this kind of company is more comparable to loss-making stocks, since the actual profit is so low. For shareholders to have confidence a company will grow profits significantly, it must grow revenue.
In the last 5 years Transurban Group saw its revenue grow at 22% per year. That's well above most pre-profit companies. It's good to see that the stock has 12%, but not entirely surprising given revenue shows strong growth. If you think there could be more growth to come, now might be the time to take a close look at Transurban Group. Opportunity lies where the market hasn't fully priced growth in the underlying business.
You can see how earnings and revenue have changed over time in the image below (click on the chart to see the exact values).
Balance sheet strength is crucial. It might be well worthwhile taking a look at our free report on how its financial position has changed over time.
What About Dividends?
As well as measuring the share price return, investors should also consider the total shareholder return (TSR). The TSR incorporates the value of any spin-offs or discounted capital raisings, along with any dividends, based on the assumption that the dividends are reinvested. It's fair to say that the TSR gives a more complete picture for stocks that pay a dividend. We note that for Transurban Group the TSR over the last 5 years was 127%, which is better than the share price return mentioned above. And there's no prize for guessing that the dividend payments largely explain the divergence!
A Different Perspective
It's good to see that Transurban Group has rewarded shareholders with a total shareholder return of 37% in the last twelve months. And that does include the dividend. Since the one-year TSR is better than the five-year TSR (the latter coming in at 18% per year), it would seem that the stock's performance has improved in recent times. In the best case scenario, this may hint at some real business momentum, implying that now could be a great time to delve deeper. Before spending more time on Transurban Group it might be wise to click here to see if insiders have been buying or selling shares.
If you would prefer to check out another company -- one with potentially superior financials -- then do not miss this free list of companies that have proven they can grow earnings.
Please note, the market returns quoted in this article reflect the market weighted average returns of stocks that currently trade on AU exchanges.
We aim to bring you long-term focused research analysis driven by fundamental data. Note that our analysis may not factor in the latest price-sensitive company announcements or qualitative material.
If you spot an error that warrants correction, please contact the editor at editorial-team@simplywallst.com. This article by Simply Wall St is general in nature. It does not constitute a recommendation to buy or sell any stock, and does not take account of your objectives, or your financial situation. Simply Wall St has no position in the stocks mentioned. Thank you for reading.
