
 Yahoo Finance
 Did UNIQA Insurance Group's (VIE:UQA) Share Price Deserve to Gain 53%?

One simple way to benefit from the stock market is to buy an index fund. But many of us dare to dream of bigger returns, and build a portfolio ourselves. For example, the UNIQA Insurance Group AG (VIE:UQA) share price is up 53% in the last three years, clearly besting than the market return of around 36% (not including dividends). On the other hand, the returns haven't been quite so good recently, with shareholders up just 3.1%, including dividends.
Check out our latest analysis for UNIQA Insurance Group
To quote Buffett, 'Ships will sail around the world but the Flat Earth Society will flourish. There will continue to be wide discrepancies between price and value in the marketplace...' One imperfect but simple way to consider how the market perception of a company has shifted is to compare the change in the earnings per share (EPS) with the share price movement.
Over the last three years, UNIQA Insurance Group failed to grow earnings per share, which fell 5.5% (annualized). This means it's unlikely the market is judging the company based on earnings growth. Given this situation, it makes sense to look at other metrics too.
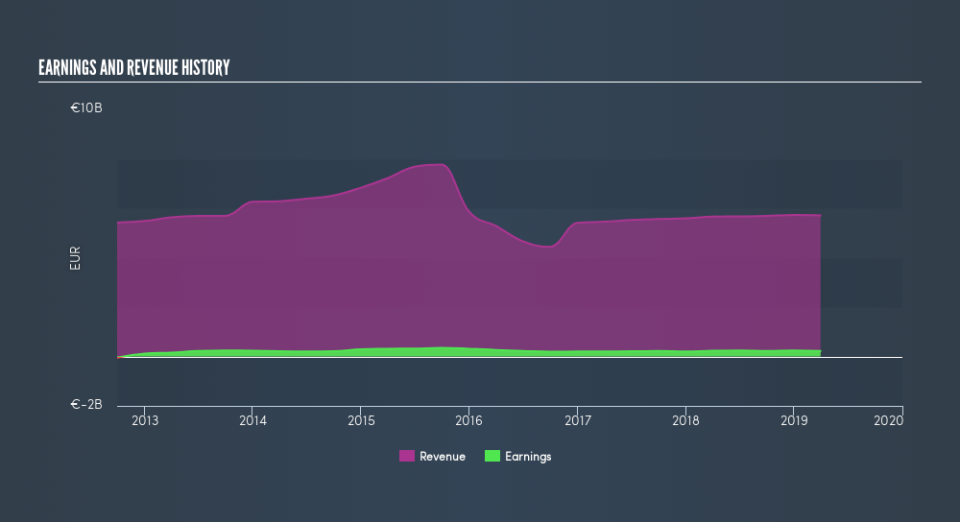
We note that the dividend is higher than it was preciously, so that may have assisted the share price. It could be that the company is reaching maturity and dividend investors are buying for the yield. On top of that, revenue grew at a rate of 5.8% per year, and it's likely investors interpret that as pointing to a brighter future.
You can see below how earnings and revenue have changed over time (discover the exact values by clicking on the image).
This free interactive report on UNIQA Insurance Group's balance sheet strength is a great place to start, if you want to investigate the stock further.
What About Dividends?
As well as measuring the share price return, investors should also consider the total shareholder return (TSR). The TSR is a return calculation that accounts for the value of cash dividends (assuming that any dividend received was reinvested) and the calculated value of any discounted capital raisings and spin-offs. So for companies that pay a generous dividend, the TSR is often a lot higher than the share price return. We note that for UNIQA Insurance Group the TSR over the last 3 years was 84%, which is better than the share price return mentioned above. And there's no prize for guessing that the dividend payments largely explain the divergence!
A Different Perspective
It's nice to see that UNIQA Insurance Group shareholders have received a total shareholder return of 3.1% over the last year. That's including the dividend. However, the TSR over five years, coming in at 4.2% per year, is even more impressive. Before forming an opinion on UNIQA Insurance Group you might want to consider the cold hard cash it pays as a dividend. This free chart tracks its dividend over time.
If you are like me, then you will not want to miss this free list of growing companies that insiders are buying.
Please note, the market returns quoted in this article reflect the market weighted average returns of stocks that currently trade on AT exchanges.
We aim to bring you long-term focused research analysis driven by fundamental data. Note that our analysis may not factor in the latest price-sensitive company announcements or qualitative material.
If you spot an error that warrants correction, please contact the editor at editorial-team@simplywallst.com. This article by Simply Wall St is general in nature. It does not constitute a recommendation to buy or sell any stock, and does not take account of your objectives, or your financial situation. Simply Wall St has no position in the stocks mentioned. Thank you for reading.
