
 Yahoo Finance
 Did Vertu Motors' (LON:VTU) Share Price Deserve to Gain 86%?
Passive investing in index funds can generate returns that roughly match the overall market. But you can significantly boost your returns by picking above-average stocks. To wit, the Vertu Motors plc (LON:VTU) share price is 86% higher than it was a year ago, much better than the market return of around 26% (not including dividends) in the same period. That's a solid performance by our standards! In contrast, the longer term returns are negative, since the share price is 8.2% lower than it was three years ago.
View our latest analysis for Vertu Motors
While markets are a powerful pricing mechanism, share prices reflect investor sentiment, not just underlying business performance. One imperfect but simple way to consider how the market perception of a company has shifted is to compare the change in the earnings per share (EPS) with the share price movement.
During the last year Vertu Motors saw its earnings per share (EPS) drop below zero. While this may prove temporary, we'd consider it a negative, so we would not have expected to see the share price up. We might get a clue to explain the share price move by looking to other metrics.
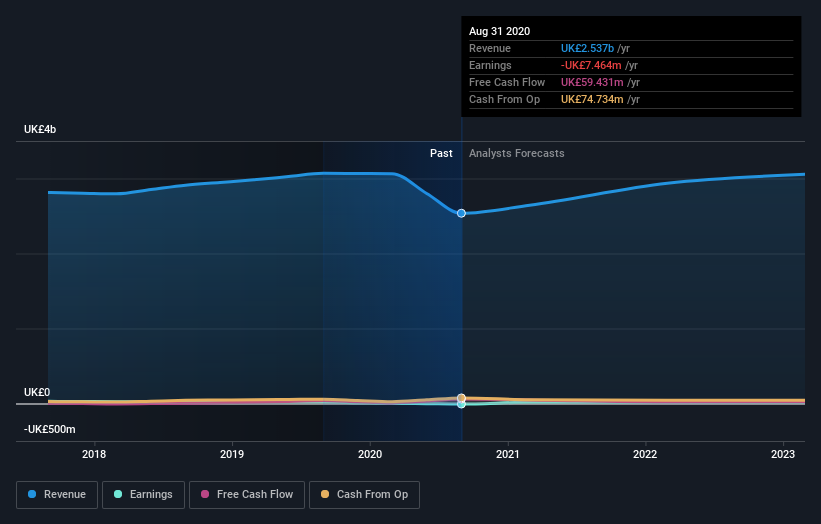
Vertu Motors' revenue actually dropped 17% over last year. So the fundamental metrics don't provide an obvious explanation for the share price gain.
The graphic below depicts how earnings and revenue have changed over time (unveil the exact values by clicking on the image).
This free interactive report on Vertu Motors' balance sheet strength is a great place to start, if you want to investigate the stock further.
A Different Perspective
It's good to see that Vertu Motors has rewarded shareholders with a total shareholder return of 86% in the last twelve months. There's no doubt those recent returns are much better than the TSR loss of 2% per year over five years. The long term loss makes us cautious, but the short term TSR gain certainly hints at a brighter future. It's always interesting to track share price performance over the longer term. But to understand Vertu Motors better, we need to consider many other factors. Even so, be aware that Vertu Motors is showing 2 warning signs in our investment analysis , you should know about...
We will like Vertu Motors better if we see some big insider buys. While we wait, check out this free list of growing companies with considerable, recent, insider buying.
Please note, the market returns quoted in this article reflect the market weighted average returns of stocks that currently trade on GB exchanges.
This article by Simply Wall St is general in nature. It does not constitute a recommendation to buy or sell any stock, and does not take account of your objectives, or your financial situation. We aim to bring you long-term focused analysis driven by fundamental data. Note that our analysis may not factor in the latest price-sensitive company announcements or qualitative material. Simply Wall St has no position in any stocks mentioned.
Have feedback on this article? Concerned about the content? Get in touch with us directly. Alternatively, email editorial-team (at) simplywallst.com.
