
 Yahoo Finance
 Did VST Industries Limited (NSE:VSTIND) Create Value For Shareholders?

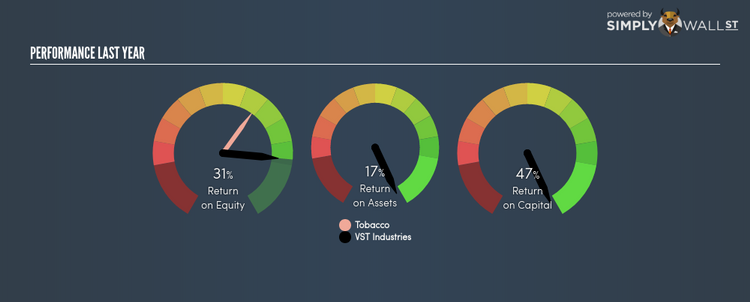
With an ROE of 31.25%, VST Industries Limited (NSEI:VSTIND) outpaced its own industry which delivered a less exciting 21.75% over the past year. On the surface, this looks fantastic since we know that VSTIND has made large profits from little equity capital; however, ROE doesn’t tell us if management have borrowed heavily to make this happen. In this article, we’ll closely examine some factors like financial leverage to evaluate the sustainability of VSTIND’s ROE. See our latest analysis for VST Industries
Breaking down Return on Equity
Return on Equity (ROE) is a measure of VST Industries’s profit relative to its shareholders’ equity. An ROE of 31.25% implies ₹0.31 returned on every ₹1 invested. While a higher ROE is preferred in most cases, there are several other factors we should consider before drawing any conclusions.
Return on Equity = Net Profit ÷ Shareholders Equity
Returns are usually compared to costs to measure the efficiency of capital. VST Industries’s cost of equity is 13.55%. This means VST Industries returns enough to cover its own cost of equity, with a buffer of 17.70%. This sustainable practice implies that the company pays less for its capital than what it generates in return. ROE can be split up into three useful ratios: net profit margin, asset turnover, and financial leverage. This is called the Dupont Formula:
Dupont Formula
ROE = profit margin × asset turnover × financial leverage
ROE = (annual net profit ÷ sales) × (sales ÷ assets) × (assets ÷ shareholders’ equity)
ROE = annual net profit ÷ shareholders’ equity
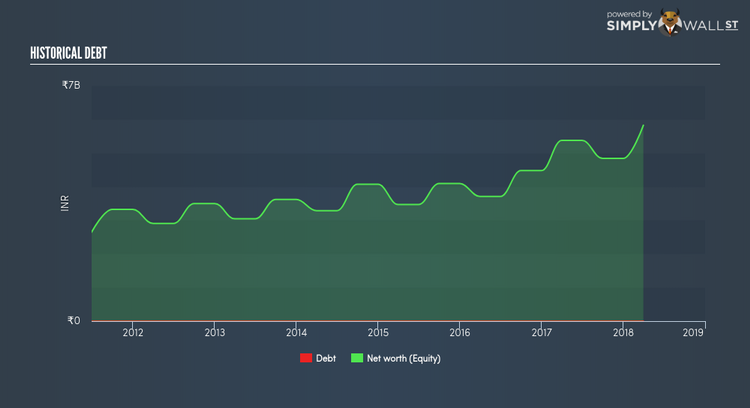
Essentially, profit margin shows how much money the company makes after paying for all its expenses. The other component, asset turnover, illustrates how much revenue VST Industries can make from its asset base. The most interesting ratio, and reflective of sustainability of its ROE, is financial leverage. Since ROE can be artificially increased through excessive borrowing, we should check VST Industries’s historic debt-to-equity ratio. Currently, VST Industries has no debt which means its returns are driven purely by equity capital. Therefore, the level of financial leverage has no impact on ROE, and the ratio is a representative measure of the efficiency of all its capital employed firm-wide.
Next Steps:
ROE is a simple yet informative ratio, illustrating the various components that each measure the quality of the overall stock. VST Industries’s ROE is impressive relative to the industry average and also covers its cost of equity. Its high ROE is not likely to be driven by high debt. Therefore, investors may have more confidence in the sustainability of this level of returns going forward. ROE is a helpful signal, but it is definitely not sufficient on its own to make an investment decision.
For VST Industries, I’ve compiled three fundamental factors you should further examine:
Financial Health: Does it have a healthy balance sheet? Take a look at our free balance sheet analysis with six simple checks on key factors like leverage and risk.
Valuation: What is VST Industries worth today? Is the stock undervalued, even when its growth outlook is factored into its intrinsic value? The intrinsic value infographic in our free research report helps visualize whether VST Industries is currently mispriced by the market.
Other High-Growth Alternatives : Are there other high-growth stocks you could be holding instead of VST Industries? Explore our interactive list of stocks with large growth potential to get an idea of what else is out there you may be missing!
To help readers see pass the short term volatility of the financial market, we aim to bring you a long-term focused research analysis purely driven by fundamental data. Note that our analysis does not factor in the latest price sensitive company announcements.
The author is an independent contributor and at the time of publication had no position in the stocks mentioned.
