
 Yahoo Finance
 Do Directors Own Aratana Therapeutics Inc (NASDAQ:PETX) Shares?

The big shareholder groups in Aratana Therapeutics Inc (NASDAQ:PETX) have power over the company. Generally speaking, as a company grows, institutions will increase their ownership. Conversely, insiders often decrease their ownership over time. Companies that used to be publicly owned tend to have lower insider ownership.
With a market capitalization of US$319m, Aratana Therapeutics is a small cap stock, so it might not be well known by many institutional investors. In the chart below below, we can see that institutional investors have bought into the company. Let’s take a closer look to see what the different types of shareholder can tell us about PETX.
See our latest analysis for Aratana Therapeutics
What Does The Institutional Ownership Tell Us About Aratana Therapeutics?
Institutions typically measure themselves against a benchmark when reporting to their own investors, so they often become more enthusiastic about a stock once it’s included in a major index. We would expect most companies to have some institutions on the register, especially if they are growing.
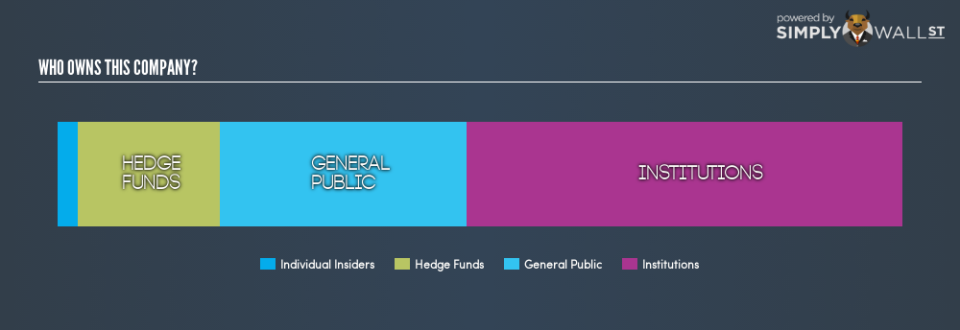
Aratana Therapeutics already has institutions on the share registry. Indeed, they own 52% of the company. This implies the analysts working for those institutions have looked at the stock and they like it. But just like anyone else, they could be wrong. If multiple institutions change their view on a stock at the same time, you could see the share price drop fast. It’s therefore worth looking at Aratana Therapeutics’s earnings history, below. Of course, the future is what really matters.

Investors should note that institutions actually own more than half the company, so they can collectively wield significant power. It looks like hedge funds own 17% of Aratana Therapeutics shares. That’s interesting, because hedge funds can be quite active and activist. Many look for medium term catalysts that will drive the share price higher. Quite a few analysts cover the stock, so you could look into forecast growth quite easily.
Insider Ownership Of Aratana Therapeutics
The definition of an insider can differ slightly between different countries, but members of the board of directors always count. Management ultimately answers to the board. However, it is not uncommon for managers to be executive board members, especially if they are a founder or the CEO.
I generally consider insider ownership to be a good thing. However, on some occasions it makes it more difficult for other shareholders to hold the board accountable for decisions.
We can see that insiders own shares in Aratana Therapeutics Inc. It has a market capitalization of just US$319m, and insiders have US$8.0m worth of shares, in their own names. This shows at least some alignment. You can click here to see if those insiders have been buying or selling.
General Public Ownership
The general public, with a 29% stake in the company, will not easily be ignored. While this group can’t necessarily call the shots, it can certainly have a real influence on how the company is run.
Next Steps:
I find it very interesting to look at who exactly owns a company. But to truly gain insight, we need to consider other information, too.
I like to dive deeper into how a company has performed in the past. You can access this interactive graph of past earnings, revenue and cash flow, for free .
If you would prefer discover what analysts are predicting in terms of future growth, do not miss this free report on analyst forecasts.
NB: Figures in this article are calculated using data from the last twelve months, which refer to the 12-month period ending on the last date of the month the financial statement is dated. This may not be consistent with full year annual report figures.
To help readers see past the short term volatility of the financial market, we aim to bring you a long-term focused research analysis purely driven by fundamental data. Note that our analysis does not factor in the latest price-sensitive company announcements.
The author is an independent contributor and at the time of publication had no position in the stocks mentioned. For errors that warrant correction please contact the editor at editorial-team@simplywallst.com.
