
 Yahoo Finance
 Are Dividend Investors Making A Mistake With Reckitt Benckiser Group plc (LON:RB.)?

Dividend paying stocks like Reckitt Benckiser Group plc (LON:RB.) tend to be popular with investors, and for good reason - some research suggests a significant amount of all stock market returns come from reinvested dividends. If you are hoping to live on the income from dividends, it's important to be a lot more stringent with your investments than the average punter.
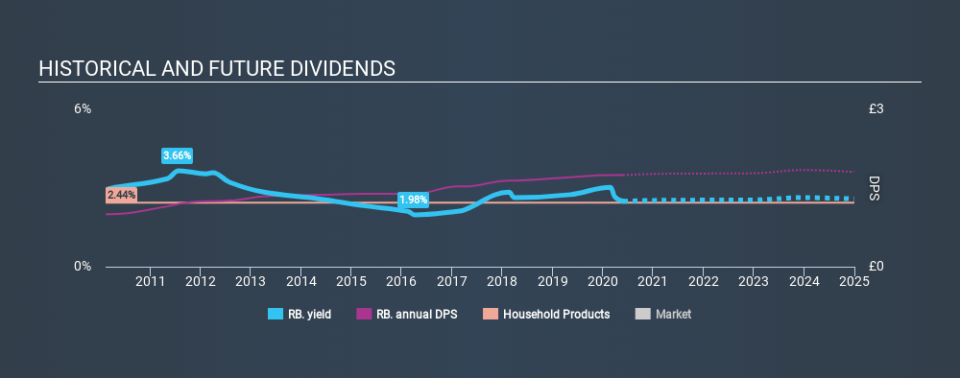
While Reckitt Benckiser Group's 2.5% dividend yield is not the highest, we think its lengthy payment history is quite interesting. When buying stocks for their dividends, you should always run through the checks below, to see if the dividend looks sustainable.
Explore this interactive chart for our latest analysis on Reckitt Benckiser Group!
Payout ratios
Dividends are usually paid out of company earnings. If a company is paying more than it earns, then the dividend might become unsustainable - hardly an ideal situation. Comparing dividend payments to a company's net profit after tax is a simple way of reality-checking whether a dividend is sustainable. While Reckitt Benckiser Group pays a dividend, it reported a loss over the last year. When a company is loss-making, we next need to check to see if its cash flows can support the dividend.
With a cash payout ratio of 127%, Reckitt Benckiser Group's dividend payments are poorly covered by cash flow.
Is Reckitt Benckiser Group's Balance Sheet Risky?
Given Reckitt Benckiser Group is paying a dividend but reported a loss over the past year, we need to check its balance sheet for signs of financial distress. A rough way to check this is with these two simple ratios: a) net debt divided by EBITDA (earnings before interest, tax, depreciation and amortisation), and b) net interest cover. Net debt to EBITDA measures total debt load relative to company earnings (lower = less debt), while net interest cover measures the ability to pay interest on the debt (higher = greater ability to pay interest costs). With net debt of 2.77 times its EBITDA, Reckitt Benckiser Group's debt burden is within a normal range for most listed companies.
Net interest cover can be calculated by dividing earnings before interest and tax (EBIT) by the company's net interest expense. With EBIT of 14.31 times its interest expense, Reckitt Benckiser Group's interest cover is quite strong - more than enough to cover the interest expense.
Remember, you can always get a snapshot of Reckitt Benckiser Group's latest financial position, by checking our visualisation of its financial health.
Dividend Volatility
From the perspective of an income investor who wants to earn dividends for many years, there is not much point buying a stock if its dividend is regularly cut or is not reliable. For the purpose of this article, we only scrutinise the last decade of Reckitt Benckiser Group's dividend payments. The dividend has been stable over the past 10 years, which is great. We think this could suggest some resilience to the business and its dividends. During the past ten-year period, the first annual payment was UK£1.00 in 2010, compared to UK£1.75 last year. This works out to be a compound annual growth rate (CAGR) of approximately 5.7% a year over that time.
Companies like this, growing their dividend at a decent rate, can be very valuable over the long term, if the rate of growth can be maintained.
Dividend Growth Potential
While dividend payments have been relatively reliable, it would also be nice if earnings per share (EPS) were growing, as this is essential to maintaining the dividend's purchasing power over the long term. It's not great to see that Reckitt Benckiser Group's have fallen at approximately 3.5% over the past five years. If earnings continue to decline, the dividend may come under pressure. Every investor should make an assessment of whether the company is taking steps to stabilise the situation.
Conclusion
To summarise, shareholders should always check that Reckitt Benckiser Group's dividends are affordable, that its dividend payments are relatively stable, and that it has decent prospects for growing its earnings and dividend. We're a bit uncomfortable with Reckitt Benckiser Group paying a dividend while loss-making, especially since the dividend was also not well covered by free cash flow. It's not great to see earnings per share shrinking. The dividends have been relatively consistent, but we wonder for how much longer this will be true. There are a few too many issues for us to get comfortable with Reckitt Benckiser Group from a dividend perspective. Businesses can change, but we would struggle to identify why an investor should rely on this stock for their income.
Market movements attest to how highly valued a consistent dividend policy is compared to one which is more unpredictable. However, there are other things to consider for investors when analysing stock performance. For example, we've identified 3 warning signs for Reckitt Benckiser Group (1 doesn't sit too well with us!) that you should be aware of before investing.
We have also put together a list of global stocks with a market capitalisation above $1bn and yielding more 3%.
Love or hate this article? Concerned about the content? Get in touch with us directly. Alternatively, email editorial-team@simplywallst.com.
This article by Simply Wall St is general in nature. It does not constitute a recommendation to buy or sell any stock, and does not take account of your objectives, or your financial situation. We aim to bring you long-term focused analysis driven by fundamental data. Note that our analysis may not factor in the latest price-sensitive company announcements or qualitative material. Simply Wall St has no position in any stocks mentioned. Thank you for reading.
