
 Yahoo Finance
 Dixons Carphone's (LON:DC.) Stock Price Has Reduced 77% In The Past Five Years

Dixons Carphone plc (LON:DC.) shareholders should be happy to see the share price up 20% in the last month. But will that heal all the wounds inflicted over 5 years of declines? Unlikely. Like a ship taking on water, the share price has sunk 77% in that time. It's true that the recent bounce could signal the company is turning over a new leaf, but we are not so sure. The fundamental business performance will ultimately determine if the turnaround can be sustained.
See our latest analysis for Dixons Carphone
To quote Buffett, 'Ships will sail around the world but the Flat Earth Society will flourish. There will continue to be wide discrepancies between price and value in the marketplace...' One way to examine how market sentiment has changed over time is to look at the interaction between a company's share price and its earnings per share (EPS).
Dixons Carphone has made a profit in the past. On the other hand, it reported a trailing twelve months loss, suggesting it isn't reliably profitable. Other metrics might give us a better handle on how its value is changing over time.
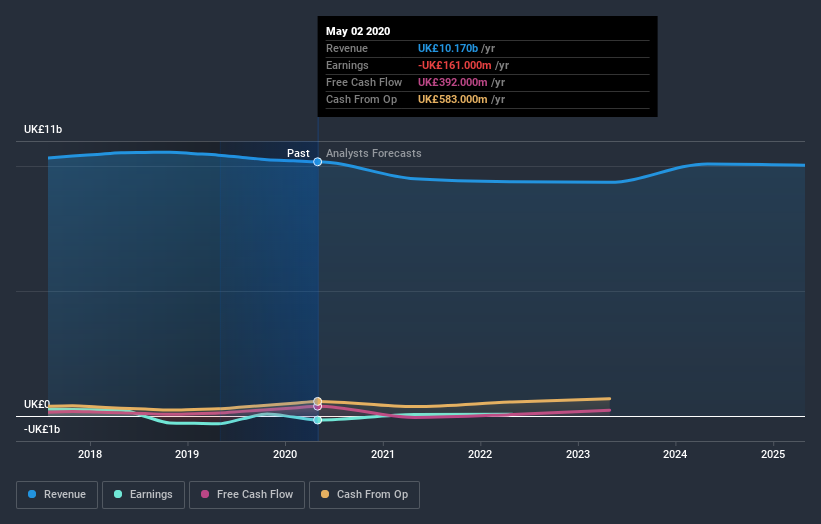
In contrast to the share price, revenue has actually increased by 3.2% a year in the five year period. So it seems one might have to take closer look at the fundamentals to understand why the share price languishes. After all, there may be an opportunity.
You can see how earnings and revenue have changed over time in the image below (click on the chart to see the exact values).
This free interactive report on Dixons Carphone's balance sheet strength is a great place to start, if you want to investigate the stock further.
What about the Total Shareholder Return (TSR)?
We'd be remiss not to mention the difference between Dixons Carphone's total shareholder return (TSR) and its share price return. The TSR attempts to capture the value of dividends (as if they were reinvested) as well as any spin-offs or discounted capital raisings offered to shareholders. Its history of dividend payouts mean that Dixons Carphone's TSR, which was a 72% drop over the last 5 years, was not as bad as the share price return.
A Different Perspective
While the broader market lost about 8.2% in the twelve months, Dixons Carphone shareholders did even worse, losing 11%. Having said that, it's inevitable that some stocks will be oversold in a falling market. The key is to keep your eyes on the fundamental developments. However, the loss over the last year isn't as bad as the 11% per annum loss investors have suffered over the last half decade. We'd need to see some sustained improvements in the key metrics before we could muster much enthusiasm. I find it very interesting to look at share price over the long term as a proxy for business performance. But to truly gain insight, we need to consider other information, too. Take risks, for example - Dixons Carphone has 1 warning sign we think you should be aware of.
But note: Dixons Carphone may not be the best stock to buy. So take a peek at this free list of interesting companies with past earnings growth (and further growth forecast).
Please note, the market returns quoted in this article reflect the market weighted average returns of stocks that currently trade on GB exchanges.
This article by Simply Wall St is general in nature. It does not constitute a recommendation to buy or sell any stock, and does not take account of your objectives, or your financial situation. We aim to bring you long-term focused analysis driven by fundamental data. Note that our analysis may not factor in the latest price-sensitive company announcements or qualitative material. Simply Wall St has no position in any stocks mentioned.
Have feedback on this article? Concerned about the content? Get in touch with us directly. Alternatively, email editorial-team@simplywallst.com.
