
 Yahoo Finance
 DMC Global Inc. (NASDAQ:BOOM) Delivered A Better ROE Than Its Industry

While some investors are already well versed in financial metrics (hat tip), this article is for those who would like to learn about Return On Equity (ROE) and why it is important. We'll use ROE to examine DMC Global Inc. (NASDAQ:BOOM), by way of a worked example.
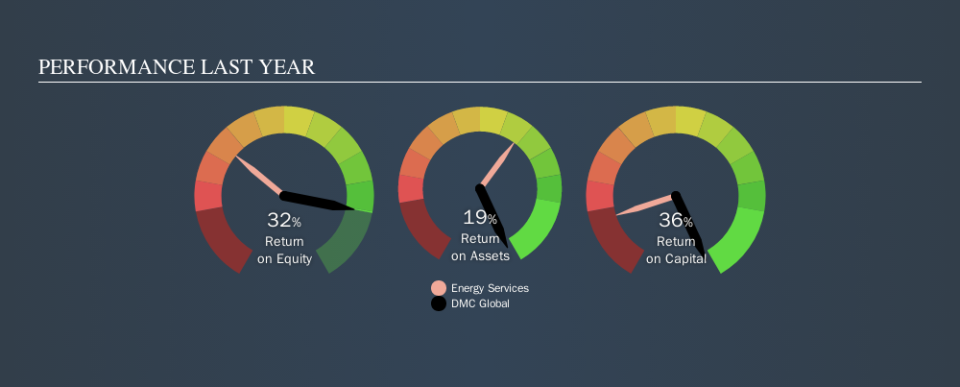
Our data shows DMC Global has a return on equity of 32% for the last year. Another way to think of that is that for every $1 worth of equity in the company, it was able to earn $0.32.
See our latest analysis for DMC Global
How Do I Calculate ROE?
The formula for return on equity is:
Return on Equity = Net Profit ÷ Shareholders' Equity
Or for DMC Global:
32% = US$52m ÷ US$164m (Based on the trailing twelve months to June 2019.)
It's easy to understand the 'net profit' part of that equation, but 'shareholders' equity' requires further explanation. It is all earnings retained by the company, plus any capital paid in by shareholders. You can calculate shareholders' equity by subtracting the company's total liabilities from its total assets.
What Does Return On Equity Mean?
ROE measures a company's profitability against the profit it retains, and any outside investments. The 'return' is the yearly profit. The higher the ROE, the more profit the company is making. So, all else equal, investors should like a high ROE. That means ROE can be used to compare two businesses.
Does DMC Global Have A Good ROE?
One simple way to determine if a company has a good return on equity is to compare it to the average for its industry. The limitation of this approach is that some companies are quite different from others, even within the same industry classification. As you can see in the graphic below, DMC Global has a higher ROE than the average (8.0%) in the Energy Services industry.
That is a good sign. In my book, a high ROE almost always warrants a closer look. One data point to check is if insiders have bought shares recently.
How Does Debt Impact Return On Equity?
Companies usually need to invest money to grow their profits. That cash can come from retained earnings, issuing new shares (equity), or debt. In the first and second cases, the ROE will reflect this use of cash for investment in the business. In the latter case, the use of debt will improve the returns, but will not change the equity. Thus the use of debt can improve ROE, albeit along with extra risk in the case of stormy weather, metaphorically speaking.
Combining DMC Global's Debt And Its 32% Return On Equity
Although DMC Global does use debt, its debt to equity ratio of 0.22 is still low. Its ROE is very impressive, and given only modest debt, this suggests the business is high quality. Careful use of debt to boost returns is often very good for shareholders. However, it could reduce the company's ability to take advantage of future opportunities.
The Bottom Line On ROE
Return on equity is one way we can compare the business quality of different companies. A company that can achieve a high return on equity without debt could be considered a high quality business. All else being equal, a higher ROE is better.
But when a business is high quality, the market often bids it up to a price that reflects this. Profit growth rates, versus the expectations reflected in the price of the stock, are a particularly important to consider. So you might want to take a peek at this data-rich interactive graph of forecasts for the company.
Of course, you might find a fantastic investment by looking elsewhere. So take a peek at this free list of interesting companies.
We aim to bring you long-term focused research analysis driven by fundamental data. Note that our analysis may not factor in the latest price-sensitive company announcements or qualitative material.
If you spot an error that warrants correction, please contact the editor at editorial-team@simplywallst.com. This article by Simply Wall St is general in nature. It does not constitute a recommendation to buy or sell any stock, and does not take account of your objectives, or your financial situation. Simply Wall St has no position in the stocks mentioned. Thank you for reading.
