
 Yahoo Finance
 Is DNB ASA's (OB:DNB) High P/E Ratio A Problem For Investors?

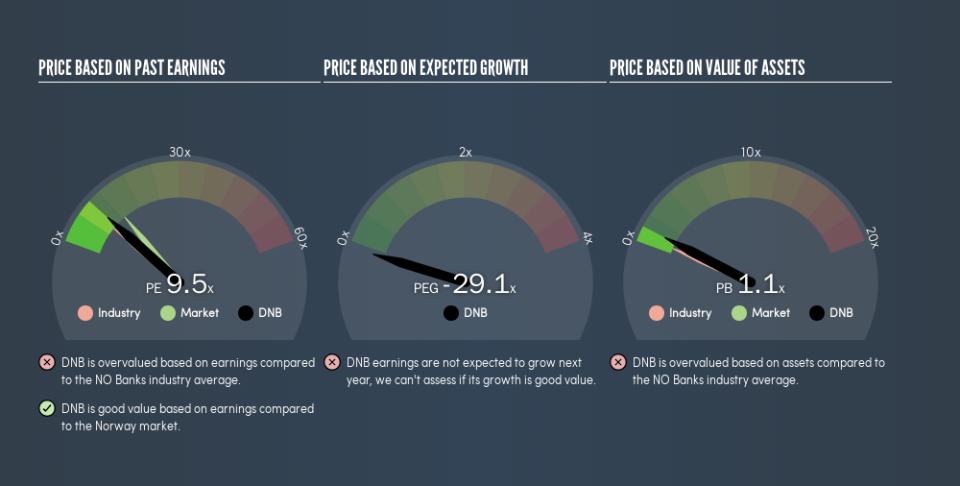
Today, we'll introduce the concept of the P/E ratio for those who are learning about investing. We'll show how you can use DNB ASA's (OB:DNB) P/E ratio to inform your assessment of the investment opportunity. DNB has a P/E ratio of 9.47, based on the last twelve months. That corresponds to an earnings yield of approximately 11%.
Check out our latest analysis for DNB
How Do I Calculate DNB's Price To Earnings Ratio?
The formula for price to earnings is:
Price to Earnings Ratio = Price per Share ÷ Earnings per Share (EPS)
Or for DNB:
P/E of 9.47 = NOK151.95 ÷ NOK16.05 (Based on the trailing twelve months to June 2019.)
Is A High Price-to-Earnings Ratio Good?
A higher P/E ratio means that investors are paying a higher price for each NOK1 of company earnings. All else being equal, it's better to pay a low price -- but as Warren Buffett said, 'It's far better to buy a wonderful company at a fair price than a fair company at a wonderful price.'
Does DNB Have A Relatively High Or Low P/E For Its Industry?
We can get an indication of market expectations by looking at the P/E ratio. The image below shows that DNB has a higher P/E than the average (8.2) P/E for companies in the banks industry.
Its relatively high P/E ratio indicates that DNB shareholders think it will perform better than other companies in its industry classification. The market is optimistic about the future, but that doesn't guarantee future growth. So investors should delve deeper. I like to check if company insiders have been buying or selling.
How Growth Rates Impact P/E Ratios
P/E ratios primarily reflect market expectations around earnings growth rates. When earnings grow, the 'E' increases, over time. And in that case, the P/E ratio itself will drop rather quickly. So while a stock may look expensive based on past earnings, it could be cheap based on future earnings.
Most would be impressed by DNB earnings growth of 14% in the last year. And it has bolstered its earnings per share by 4.9% per year over the last five years. With that performance, you might expect an above average P/E ratio.
Don't Forget: The P/E Does Not Account For Debt or Bank Deposits
It's important to note that the P/E ratio considers the market capitalization, not the enterprise value. So it won't reflect the advantage of cash, or disadvantage of debt. In theory, a company can lower its future P/E ratio by using cash or debt to invest in growth.
While growth expenditure doesn't always pay off, the point is that it is a good option to have; but one that the P/E ratio ignores.
How Does DNB's Debt Impact Its P/E Ratio?
DNB has net debt worth a very significant 299% of its market capitalization. This level of debt justifies a relatively low P/E, so remain cognizant of the debt, if you're comparing it to other stocks.
The Bottom Line On DNB's P/E Ratio
DNB trades on a P/E ratio of 9.5, which is below the NO market average of 12.3. The company has a meaningful amount of debt on the balance sheet, but that should not eclipse the solid earnings growth. If the company can continue to grow earnings, then the current P/E may be unjustifiably low.
When the market is wrong about a stock, it gives savvy investors an opportunity. If it is underestimating a company, investors can make money by buying and holding the shares until the market corrects itself. So this free visual report on analyst forecasts could hold the key to an excellent investment decision.
Of course you might be able to find a better stock than DNB. So you may wish to see this free collection of other companies that have grown earnings strongly.
We aim to bring you long-term focused research analysis driven by fundamental data. Note that our analysis may not factor in the latest price-sensitive company announcements or qualitative material.
If you spot an error that warrants correction, please contact the editor at editorial-team@simplywallst.com. This article by Simply Wall St is general in nature. It does not constitute a recommendation to buy or sell any stock, and does not take account of your objectives, or your financial situation. Simply Wall St has no position in the stocks mentioned. Thank you for reading.
