
 Yahoo Finance
 What does Altran Technologies SA.’s (EPA:ALT) Balance Sheet Tell Us About Its Future?

Stocks with market capitalization between $2B and $10B, such as Altran Technologies SA. (ENXTPA:ALT) with a size of €3.30B, do not attract as much attention from the investing community as do the small-caps and large-caps. However, history shows that overlooked mid-cap companies have performed better on a risk-adjusted manner than the smaller and larger segment of the market. Today we will look at ALT’s financial liquidity and debt levels, which are strong indicators for whether the company can weather economic downturns or fund strategic acquisitions for future growth. Don’t forget that this is a general and concentrated examination of Amazon’s financial health, so you should conduct further analysis into ALT here. See our latest analysis for Altran Technologies
Does ALT generate an acceptable amount of cash through operations?
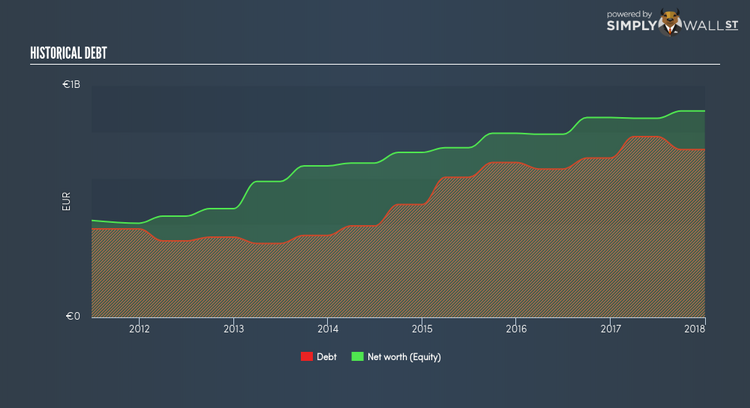
ALT’s debt levels surged from €687.87M to €724.00M over the last 12 months – this includes both the current and long-term debt. With this growth in debt, the current cash and short-term investment levels stands at €375.58M , ready to deploy into the business. Additionally, ALT has produced €161.03M in operating cash flow over the same time period, resulting in an operating cash to total debt ratio of 22.24%, meaning that ALT’s debt is appropriately covered by operating cash. This ratio can also be interpreted as a measure of efficiency as an alternative to return on assets. In ALT’s case, it is able to generate 0.22x cash from its debt capital.
Can ALT pay its short-term liabilities?
With current liabilities at €1.31B, it appears that the company has not maintained a sufficient level of current assets to meet its obligations, with the current ratio last standing at 0.77x, which is below the prudent industry ratio of 3x.
Can ALT service its debt comfortably?
ALT is a relatively highly levered company with a debt-to-equity of 81.30%. This is not uncommon for a mid-cap company given that debt tends to be lower-cost and at times, more accessible. We can test if ALT’s debt levels are sustainable by measuring interest payments against earnings of a company. Ideally, earnings before interest and tax (EBIT) should cover net interest by at least three times. For ALT, the ratio of 20.48x suggests that interest is comfortably covered, which means that lenders may be less hesitant to lend out more funding as ALT’s high interest coverage is seen as responsible and safe practice.
Next Steps:
With a high level of debt on its balance sheet, ALT could still be in a financially strong position if its cash flow also stacked up. However, this isn’t the case, and there’s room for ALT to increase its operational efficiency. In addition to this, its lack of liquidity raises questions over current asset management practices for the mid-cap. I admit this is a fairly basic analysis for ALT’s financial health. Other important fundamentals need to be considered alongside. You should continue to research Altran Technologies to get a more holistic view of the stock by looking at:
Future Outlook: What are well-informed industry analysts predicting for ALT’s future growth? Take a look at our free research report of analyst consensus for ALT’s outlook.
Valuation: What is ALT worth today? Is the stock undervalued, even when its growth outlook is factored into its intrinsic value? The intrinsic value infographic in our free research report helps visualize whether ALT is currently mispriced by the market.
Other High-Performing Stocks: Are there other stocks that provide better prospects with proven track records? Explore our free list of these great stocks here.
To help readers see pass the short term volatility of the financial market, we aim to bring you a long-term focused research analysis purely driven by fundamental data. Note that our analysis does not factor in the latest price sensitive company announcements.
The author is an independent contributor and at the time of publication had no position in the stocks mentioned.
