
 Yahoo Finance
 Does The Alumasc Group plc’s (LON:ALU) Recent Track Record Look Strong?

Examining The Alumasc Group plc’s (LON:ALU) past track record of performance is an insightful exercise for investors. It allows us to reflect on whether or not the company has met or exceed expectations, which is a great indicator for future performance. Today I will assess ALU’s latest performance announced on 31 December 2017 and compare these figures to its longer term trend and industry movements. See our latest analysis for Alumasc Group
Commentary On ALU’s Past Performance
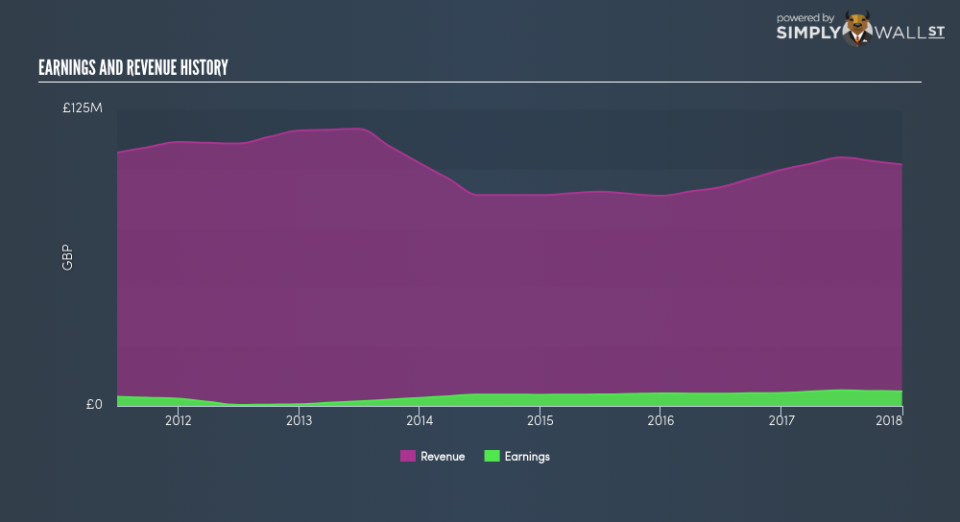
ALU’s trailing twelve-month earnings (from 31 December 2017) of UK£6.09m has jumped 10.73% compared to the previous year. However, this one-year growth rate has been lower than its average earnings growth rate over the past 5 years of 19.42%, indicating the rate at which ALU is growing has slowed down. What could be happening here? Well, let’s look at what’s going on with margins and if the rest of the industry is facing the same headwind.
In the past few years, revenue growth has fallen behind earnings, which implies that Alumasc Group’s bottom line has been propelled by unsustainable cost-reductions. Viewing growth from a sector-level, the UK building industry has been growing, albeit, at a subdued single-digit rate of 3.69% in the past twelve months, and a substantial 19.42% over the previous five years. This shows that whatever recent headwind the industry is experiencing, Alumasc Group is relatively better-cushioned than its peers.
In terms of returns from investment, Alumasc Group has invested its equity funds well leading to a 30.08% return on equity (ROE), above the sensible minimum of 20%. Furthermore, its return on assets (ROA) of 9.76% exceeds the GB Building industry of 8.48%, indicating Alumasc Group has used its assets more efficiently. And finally, its return on capital (ROC), which also accounts for Alumasc Group’s debt level, has increased over the past 3 years from 12.30% to 16.71%. This correlates with a decrease in debt holding, with debt-to-equity ratio declining from 101.89% to 14.58% over the past 5 years.
What does this mean?
Though Alumasc Group’s past data is helpful, it is only one aspect of my investment thesis. While Alumasc Group has a good historical track record with positive growth and profitability, there’s no certainty that this will extrapolate into the future. You should continue to research Alumasc Group to get a better picture of the stock by looking at:
Financial Health: Is ALU’s operations financially sustainable? Balance sheets can be hard to analyze, which is why we’ve done it for you. Check out our financial health checks here.
Other High-Performing Stocks: Are there other stocks that provide better prospects with proven track records? Explore our free list of these great stocks here.
NB: Figures in this article are calculated using data from the trailing twelve months from 31 December 2017. This may not be consistent with full year annual report figures.
To help readers see pass the short term volatility of the financial market, we aim to bring you a long-term focused research analysis purely driven by fundamental data. Note that our analysis does not factor in the latest price sensitive company announcements.
The author is an independent contributor and at the time of publication had no position in the stocks mentioned.
