
 Yahoo Finance
 Does Aratana Therapeutics, Inc.’s (NASDAQ:PETX) CEO Pay Compare Well With Peers?

Steven St. Peter has been the CEO of Aratana Therapeutics, Inc. (NASDAQ:PETX) since 2012. This report will, first, examine the CEO compensation levels in comparison to CEO compensation at companies of similar size. Next, we’ll consider growth that the business demonstrates. And finally we will reflect on how common stockholders have fared in the last few years, as a secondary measure of performance. This process should give us an idea about how appropriately the CEO is paid.
Check out our latest analysis for Aratana Therapeutics
Want to help shape the future of investing tools and platforms? Take the survey and be part of one of the most advanced studies of stock market investors to date.
How Does Steven St. Peter’s Compensation Compare With Similar Sized Companies?
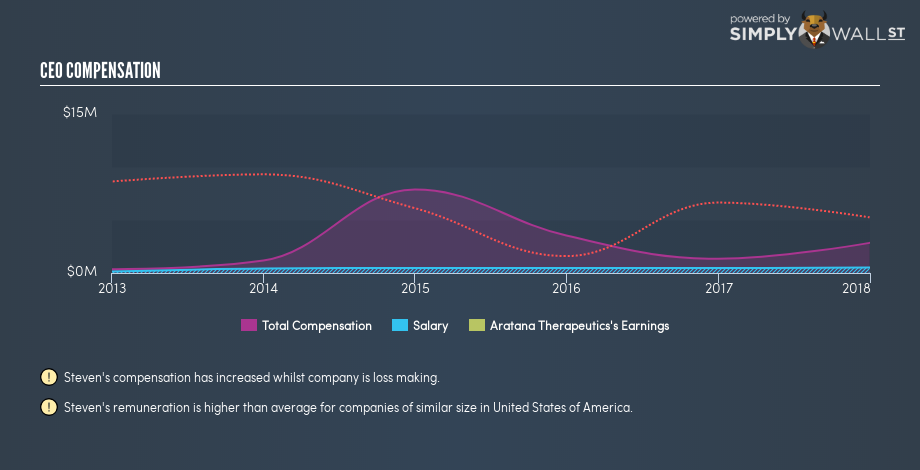
At the time of writing our data says that Aratana Therapeutics, Inc. has a market cap of US$316m, and is paying total annual CEO compensation of US$2.8m. (This figure is for the year to 2017). While we always look at total compensation first, we note that the salary component is less, at US$513k. We examined companies with market caps from US$200m to US$800m, and discovered that the median CEO compensation of that group was US$1.6m.
Thus we can conclude that Steven St. Peter receives more in total compensation than the median of a group of companies in the same market, and of similar size to Aratana Therapeutics, Inc.. However, this doesn’t necessarily mean the pay is too high. We can get a better idea of how generous the pay is by looking at the performance of the underlying business.
The graphic below shows how CEO compensation at Aratana Therapeutics has changed from year to year.
Is Aratana Therapeutics, Inc. Growing?
Aratana Therapeutics, Inc. has increased its earnings per share (EPS) by an average of 40% a year, over the last three years (using a line of best fit). Its revenue is up 166% over last year.
This demonstrates that the company has been improving recently. A good result. It’s great to see that revenue growth is strong, too. These metrics suggest the business is growing strongly.
It could be important to check this free visual depiction of what analysts expect for the future.
Has Aratana Therapeutics, Inc. Been A Good Investment?
Most shareholders would probably be pleased with Aratana Therapeutics, Inc. for providing a total return of 36% over three years. So they may not be at all concerned if the CEO were to be paid more than is normal for companies around the same size.
In Summary…
We compared total CEO remuneration at Aratana Therapeutics, Inc. with the amount paid at companies with a similar market capitalization. Our data suggests that it pays above the median CEO pay within that group.
Importantly, though, the company has impressed with its earnings per share growth, over three years. On top of that, in the same period, returns to shareholders have been great. So, considering this good performance, the CEO compensation may be quite appropriate. Shareholders may want to check for free if Aratana Therapeutics insiders are buying or selling shares.
Or you might prefer examine intently this intuitive graph showing past earnings and revenue.
To help readers see past the short term volatility of the financial market, we aim to bring you a long-term focused research analysis purely driven by fundamental data. Note that our analysis does not factor in the latest price-sensitive company announcements.
The author is an independent contributor and at the time of publication had no position in the stocks mentioned. For errors that warrant correction please contact the editor at editorial-team@simplywallst.com.
