
 Yahoo Finance
 Does artnet AG's (FRA:ART) P/E Ratio Signal A Buying Opportunity?

Want to participate in a short research study? Help shape the future of investing tools and you could win a $250 gift card!
This article is written for those who want to get better at using price to earnings ratios (P/E ratios). We'll look at artnet AG's (FRA:ART) P/E ratio and reflect on what it tells us about the company's share price. What is artnet's P/E ratio? Well, based on the last twelve months it is 21.59. That corresponds to an earnings yield of approximately 4.6%.
View our latest analysis for artnet
How Do You Calculate A P/E Ratio?
The formula for P/E is:
Price to Earnings Ratio = Price per Share ÷ Earnings per Share (EPS)
Or for artnet:
P/E of 21.59 = €4.06 ÷ €0.19 (Based on the year to December 2018.)
Is A High Price-to-Earnings Ratio Good?
A higher P/E ratio means that investors are paying a higher price for each €1 of company earnings. That isn't necessarily good or bad, but a high P/E implies relatively high expectations of what a company can achieve in the future.
How Does artnet's P/E Ratio Compare To Its Peers?
The P/E ratio indicates whether the market has higher or lower expectations of a company. The image below shows that artnet has a lower P/E than the average (24.5) P/E for companies in the online retail industry.
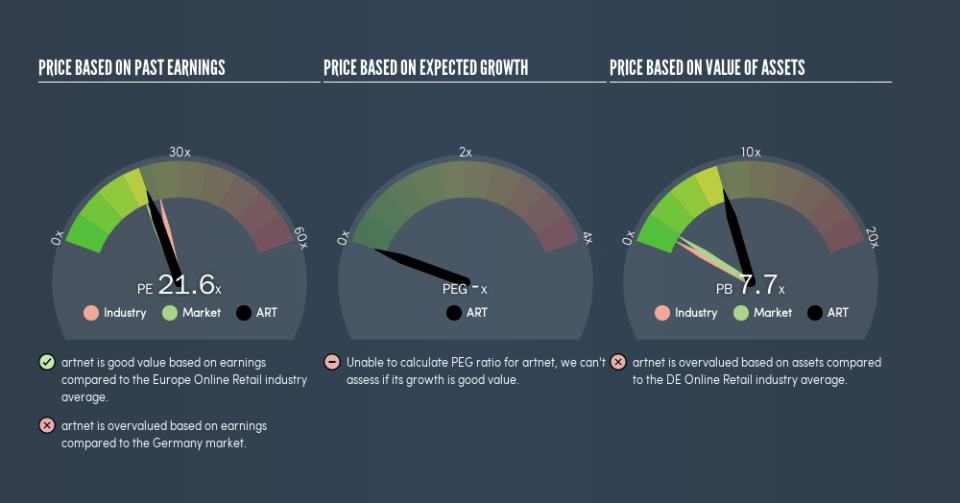
This suggests that market participants think artnet will underperform other companies in its industry. While current expectations are low, the stock could be undervalued if the situation is better than the market assumes. It is arguably worth checking if insiders are buying shares, because that might imply they believe the stock is undervalued.
How Growth Rates Impact P/E Ratios
Generally speaking the rate of earnings growth has a profound impact on a company's P/E multiple. That's because companies that grow earnings per share quickly will rapidly increase the 'E' in the equation. And in that case, the P/E ratio itself will drop rather quickly. And as that P/E ratio drops, the company will look cheap, unless its share price increases.
In the last year, artnet grew EPS like Taylor Swift grew her fan base back in 2010; the 50% gain was both fast and well deserved. The cherry on top is that the five year growth rate was an impressive 92% per year. With that kind of growth rate we would generally expect a high P/E ratio.
Remember: P/E Ratios Don't Consider The Balance Sheet
Don't forget that the P/E ratio considers market capitalization. That means it doesn't take debt or cash into account. Hypothetically, a company could reduce its future P/E ratio by spending its cash (or taking on debt) to achieve higher earnings.
Such spending might be good or bad, overall, but the key point here is that you need to look at debt to understand the P/E ratio in context.
Is Debt Impacting artnet's P/E?
The extra options and safety that comes with artnet's €726k net cash position means that it deserves a higher P/E than it would if it had a lot of net debt.
The Bottom Line On artnet's P/E Ratio
artnet has a P/E of 21.6. That's around the same as the average in the DE market, which is 20.4. The excess cash it carries is the gravy on top its fast EPS growth. So at a glance we're a bit surprised that artnet does not have a higher P/E ratio.
When the market is wrong about a stock, it gives savvy investors an opportunity. People often underestimate remarkable growth -- so investors can make money when fast growth is not fully appreciated. We don't have analyst forecasts, but shareholders might want to examine this detailed historical graph of earnings, revenue and cash flow.
Of course you might be able to find a better stock than artnet. So you may wish to see this free collection of other companies that have grown earnings strongly.
We aim to bring you long-term focused research analysis driven by fundamental data. Note that our analysis may not factor in the latest price-sensitive company announcements or qualitative material.
If you spot an error that warrants correction, please contact the editor at editorial-team@simplywallst.com. This article by Simply Wall St is general in nature. It does not constitute a recommendation to buy or sell any stock, and does not take account of your objectives, or your financial situation. Simply Wall St has no position in the stocks mentioned. Thank you for reading.
